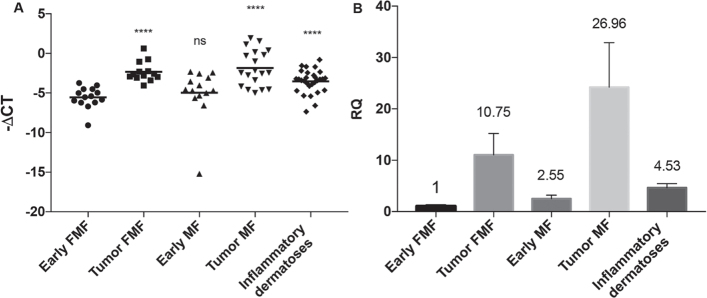
Fig. 2.
miR-155 expression in folliculotropic mycosis fungoides (FMF), classical mycosis fungoides (MF) and T-cell-rich inflammatory dermatoses. (A) Expression level of miR-155 as measured by miRNA qPCR in early-stage FMF (n = 14), tumour-stage FMF (n = 13), early-classic MF (n=14), tumour-stage MF (n = 19) and inflammatory dermatoses (n = 29). Delta Ct for each group was calculated and represented by –ΔCt. Horizontal bars represent the –ΔCt mean for each patients group. ****Statistically significant difference in ΔCt compared with early-stage FMF with p < 0.0001. (B) The fold change of miR-155 expression using early-stage FMF as the reference group. Values above the bars represent the fold change. ns: non-significant; RQ: relative quantification.

