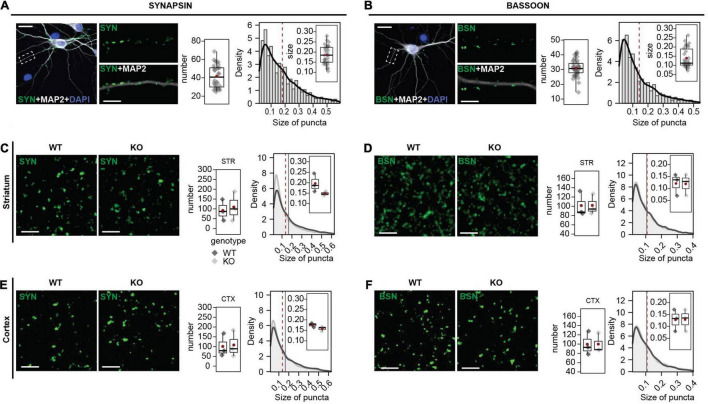
FIGURE 3.
SYNAPSIN1/2 and BASSOON expression in primary hippocampal neurons, mouse striatum, and cortex. (A) SYNAPSIN1/2 and MAP2 ICC in primary hippocampal neurons. The number of SYNAPSIN1/2 positive synapses per 30 μm secondary dendrite and the size of the puncta were analyzed. (B) BASSOON and MAP2 ICC in primary hippocampal neurons. The number of BASSOON-positive synapses per 30 μm secondary dendrite and the size of the puncta were analyzed. Scale bar 20 μm. (C) SYNAPSIN1/2 IHC in striatum of WT and Shank3 KO mice. The number of SYNAPSIN1/2-positive synapses per 17 μm2 and the size of the puncta were analyzed. Scale bar 20 μm. (D) BASSOON IHC in striatum of WT and Shank3 KO mice. The number of BASSOON-positive synapses per 17 μm2 and the size of the puncta were analyzed. (E) SYNAPSIN1/2 IHC cortex of WT and Shank3 KO mice. The number of SYNAPSIN1/2-positive synapses per 17 μm2 and the size of the puncta were analyzed. (F) BASSOON IHC in cortex of WT and Shank3 KO mice. The number of BASSOON-positive synapses per 17 μm2 and the size of the puncta were analyzed. Scale bar 5 μm. Left graph: Number of synapses. Right graph: Size of SYNAPSIN1/2 puncta, frequency distribution (bins) and estimated density (black line). The boxplot shows the median and the interquartile range, the whiskers cover minimal-to-maximal values. The red dot or the red line mark the mean. ICC: Data collected from a total of 40 cells of 4 independent experiments. IHC: n = 3 mice per genotype. WT: Shank3(+/+), KO: Shank3Δex11(–/–) mice. Groups were tested for normality using the Shapiro–Wilk test and then compared using the Wilcoxon test.

