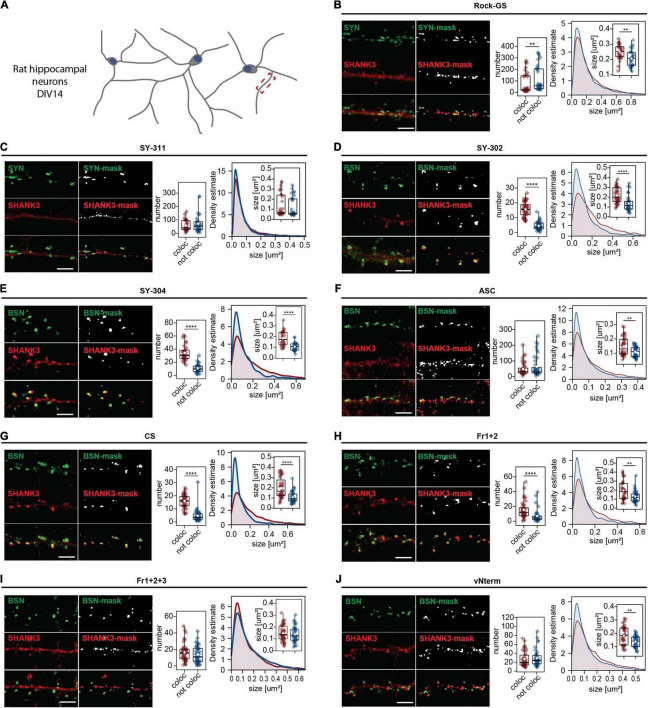
FIGURE 4.
ICC analysis in primary rat hippocampal neurons. (A) Neurons have been fixed at DIV14 and secondary dendrites were analyzed. Cells were stained against MAP2, SYNAPSIN1/2, or BASSOON and (B) Rock-GS, (C) SY-311, (D) SY-302, (E) SY-304, (F) ASC, (G) CS, (H) Fr1+2, (I) Fr1+2+3, and (J) vNterm. Scale bar 5 μm. ICC and the derived mask obtained in ImageJ with FindFoci are shown. Left graph: Number of synapses. SHANK3 puncta co-localizing with the respective pre-synaptic marker (red) or not co-localizing (blue) are shown. Right graph: Size of SHANK3 puncta and estimated density. The boxplot shows the median and the interquartile range, the whiskers cover minimal to maximal values. The white dot marks the mean. Data collected from a total of 40 cells of 4 independent experiments. Groups were tested for normality using the Shapiro–Wilk test and then compared using the Wilcoxon test. **p ≤ 0.01, ****p ≤ 0.0001.

