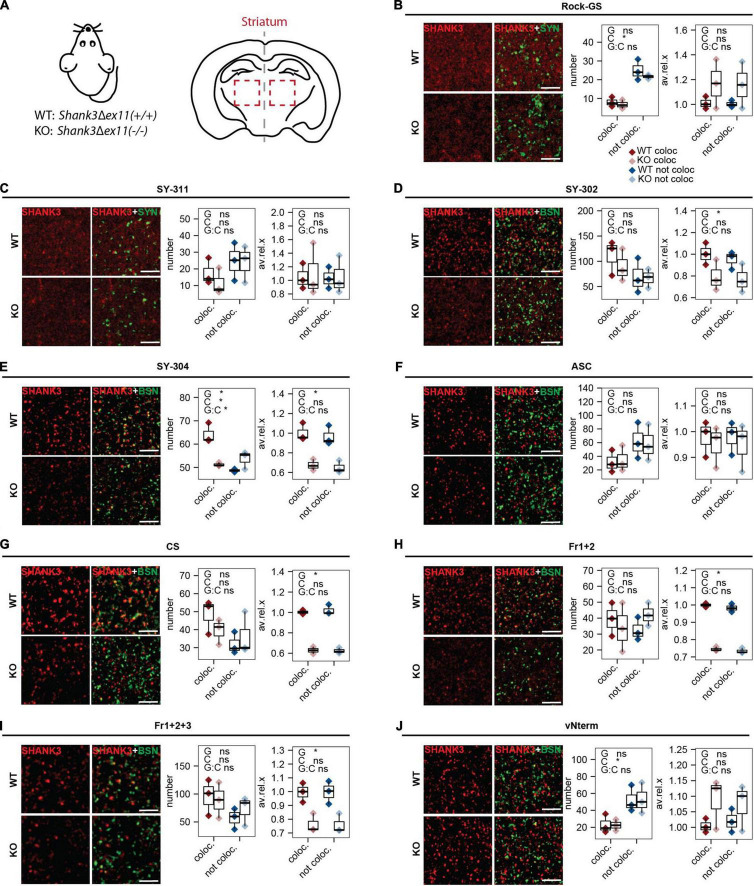
FIGURE 5.
IHC analysis in striatum of mouse brain sections. (A) Sections of WT [Shank3(+/+)] and KO [Shank3Δex11(–/–)] mice were analyzed. Sections were stained against SYNAPSIN1/2 or BASSOON and (B) Rock-GS, (C) SY-311, (D) SY-302, (E) SY-304, (F) ASC, (G) CS, (H) Fr1+2, (I) Fr1+2+3, and (J) vNterm. Scale bar 5 μm. ICC of WT and KO are shown. Left graph: Number of synapses. SHANK3 puncta co-localizing with the respective pre-synaptic marker (red) or not co-localizing (blue) are shown. Right graph: Average intensity of SHANK3 puncta. The boxplot shows the median and the interquartile range, the whiskers cover minimal to maximal values. n = 3 animals per genotype. One-way ANOVA. G: genotype. C: co-localization or not. G:C: correlation of genotype and co-localization. *p ≤ 0.05.

