Abstract
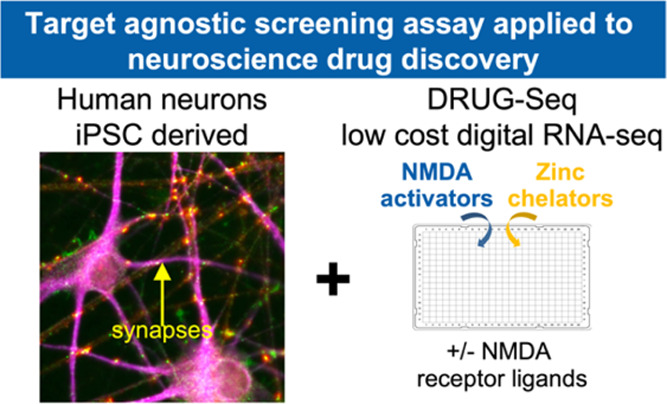
Unbiased transcriptomic RNA-seq data has provided deep insights into biological processes. However, its impact in drug discovery has been narrow given high costs and low throughput. Proof-of-concept studies with Digital RNA with pertUrbation of Genes (DRUG)-seq demonstrated the potential to address this gap. We extended the DRUG-seq platform by subjecting it to rigorous testing and by adding an open-source analysis pipeline. The results demonstrate high reproducibility and ability to resolve the mechanism(s) of action for a diverse set of compounds. Furthermore, we demonstrate how this data can be incorporated into a drug discovery project aiming to develop therapeutics for schizophrenia using human stem cell-derived neurons. We identified both an on-target activation signature, induced by a set of chemically distinct positive allosteric modulators of the N-methyl-d-aspartate (NMDA) receptor, and independent off-target effects. Overall, the protocol and open-source analysis pipeline are a step toward industrializing RNA-seq for high-complexity transcriptomics studies performed at a saturating scale.
Introduction
In the pharmaceutical industry, it is standard to test thousands of compounds in high-throughput screens to identify regulators of a target or a biological process.1,2 This massive scale is made possible by focusing on a single readout. However, biological systems are inherently complex, and there is a need for scalable screening methods that can capture the total biological activity of small-molecule libraries. Whole-transcriptome analysis, by RNA-seq, offers a high-dimensional readout but is cost prohibitive and is typically performed on a small number of samples.3,4
To reduce costs, targeted RNA-seq approaches such as L1000 or RASL-seq have been deployed successfully as large-scale transcriptomic profiling methods.5,6 Targeted approaches such as these can be tailored to any gene set of interest, but it takes time to optimize gene sets for any given disease or cell model,7 and this approach may miss unexpected and potentially important transcriptomic signatures. Single-cell RNA-seq can detect a few thousand genes per cell in an unbiased way. Recently, the sci-Plex method identified cell-specific transcriptional responses to hundreds of compounds by labeling the cells in each treated well with a single-stranded DNA barcode that binds to nuclei prior to a single-cell (sc)RNA-seq sample processing, which enables sample multiplexing.8 It will be promising to apply methods like sci-Plex to study the single-cell effects of treatment in complex tissue models, such as brain organoids.9 As cell diversity increases, 1000s of cells must be profiled to detect responses in lower abundance or rare cell types. For more homogeneous cell culture models, scRNA-seq plus perturbation methods may offer less of an advantage over bulk RNA-seq methods and cellular resolution comes at the expense of throughput of perturbations tested and the number of genes detected.
Digital RNA with pertUrbation of Genes (DRUG)-seq is a low-cost, high-throughput bulk RNA-seq method that uses a direct in-well lysis of cells in 384-well plates and is ideal for studying the transcriptomic effect of many compound treatments in parallel.10 Multiple groups have been working to develop unbiased whole transcriptome-wide methods that are lower cost.11−13 The pace of development in this field makes it difficult to compare data or perform exhaustive benchmarking studies to compare the performance of the methods. As a key step toward this, we created an experimental design to thoroughly test the DRUG-seq platform and made the methods, data, and code available for independent verification and reproduction of the results. By exhaustively testing reproducibility across batches and plates, we demonstrate that DRUG-seq provides the granularity to bin compounds by the mechanism of action (MoA) and meets the performance standards required of an industry-scale RNA-seq platform. We also demonstrate how DRUG-seq can impact drug development projects with an example from a study designed to probe both the on- and off-target effects of novel N-methyl-d-aspartate (NMDA) receptor potentiators as therapeutics for schizophrenia.
Results
Summary of Protocol and Experimental Design
DRUG-seq pairs high-throughput cell culture with miniaturized RNA-seq (Figure 1A). Cells are first cultured in 384-well plates and then treated with compounds for a desired period of time. After the treatment, the cells are directly lysed in each well, without RNA purification. The RNA in each well is used as a template for reverse transcription (RT), where the DRUG-seq RT primers incorporate both the well barcodes and unique molecular identifiers (UMI) (Figure 1B). After RT, the samples are pooled and used as a template for second-strand cDNA synthesis and subsequent library construction. During library construction, Tn5-mediated cDNA tagmentation is performed, which enzymatically fragments and adds Illumina adaptors to each insert. Next plate-level barcodes are incorporated to track multiple plates simultaneously. Finally, for optimal sequencing, libraries are size-selected and quality checked by DNA fragment analysis. After quantification, libraries for each plate(s) are normalized and pooled, such that we can accurately target sequencing at a read depth equivalent to 1 million reads per well on the Illumina platform. The final product is 3′ biased; full-length transcripts are not sequenced. The protocol scale can be adapted depending on the experimental need and resources available.
Figure 1.
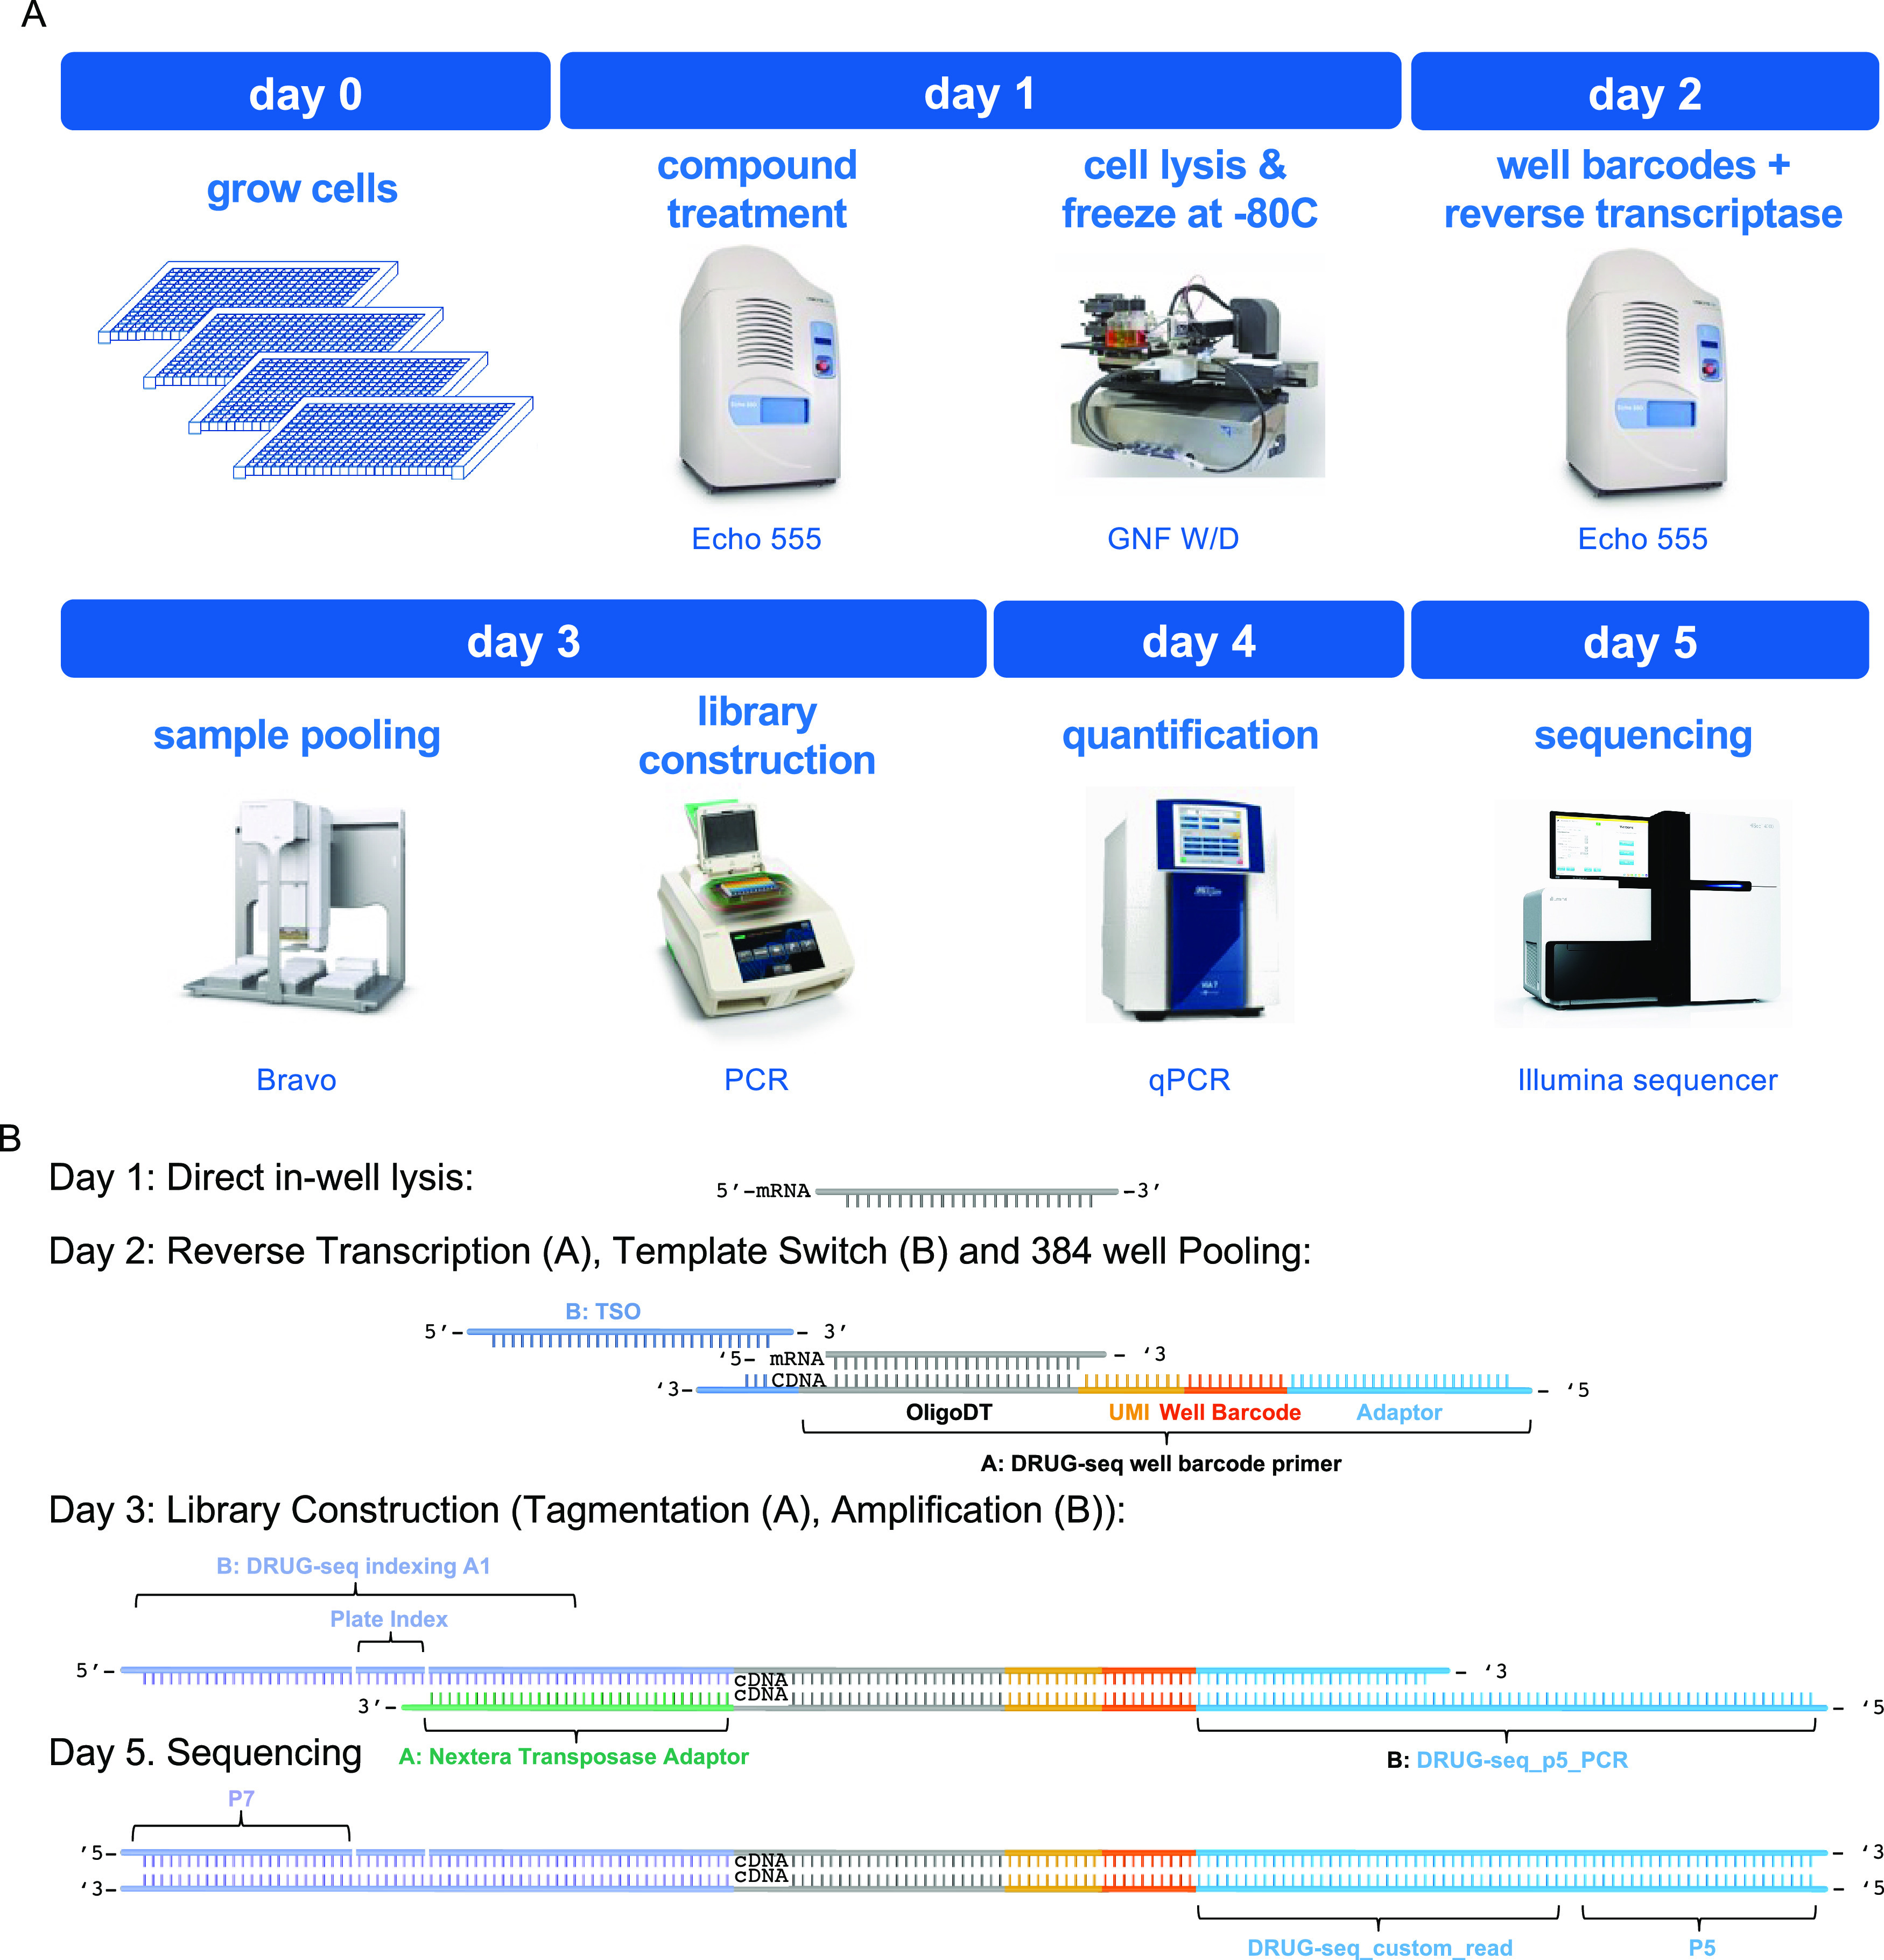
Overview of the DRUG-seq protocol. (A) Once cells are plated and treated with perturbagens, the DRUG-seq protocol can be performed and sequenced in 5 days. The process and equipment depicted here is for batches of 18 or fewer plates. Scale up or down is possible depending upon infrastructure available. Echo 555 image—©2022 Beckman Coulter, Inc. Used with permission. Bravo image—©Agilent Technologies, Inc. Reproduced with Permission, Courtesy of Agilent Technologies, Inc. C1000 touch image—Courtesy of Bio-Rad Laboratories, Inc., © 2022. ViiA 7 image—ThermoFisher Scientific Inc. HiSeq. 4000 image—Used under license from Illumina, Inc. All Rights Reserved. (B) Depiction of the DRUG-seq high-throughput RNA-seq chemistry (adapted from Ye et al., 2018). Day 1: the scale of DRUG-seq is enabled using a direct in-well lysis of cells without mRNA purification, which is coupled to a barcoding and sequencing strategy that tracks transcripts (UMI), wells (well barcode) on day 2. On day 3, library construction incorporates plate barcodes and generates cDNA libraries (illumina Nextera or custom Illumina indexes) to be quantified and sequenced on the illumina platform (days 4–5).
We designed an experiment to evaluate the reproducibility of the DRUG-seq protocol (Figure 2A). We generated three independent batches of U-2 OS cells on different days, plated in three replicate 384-well plates per batch for a total of 9 × 384-well plates. In each plate, we treated cells with 14 compounds (Figure 2B, File S1, Table 1), each with an eight-point dose response (3.2 nM to 10 μM) with three replicates for each dose. This design was used to test the performance between the batches of cells and plate(s).
Figure 2.
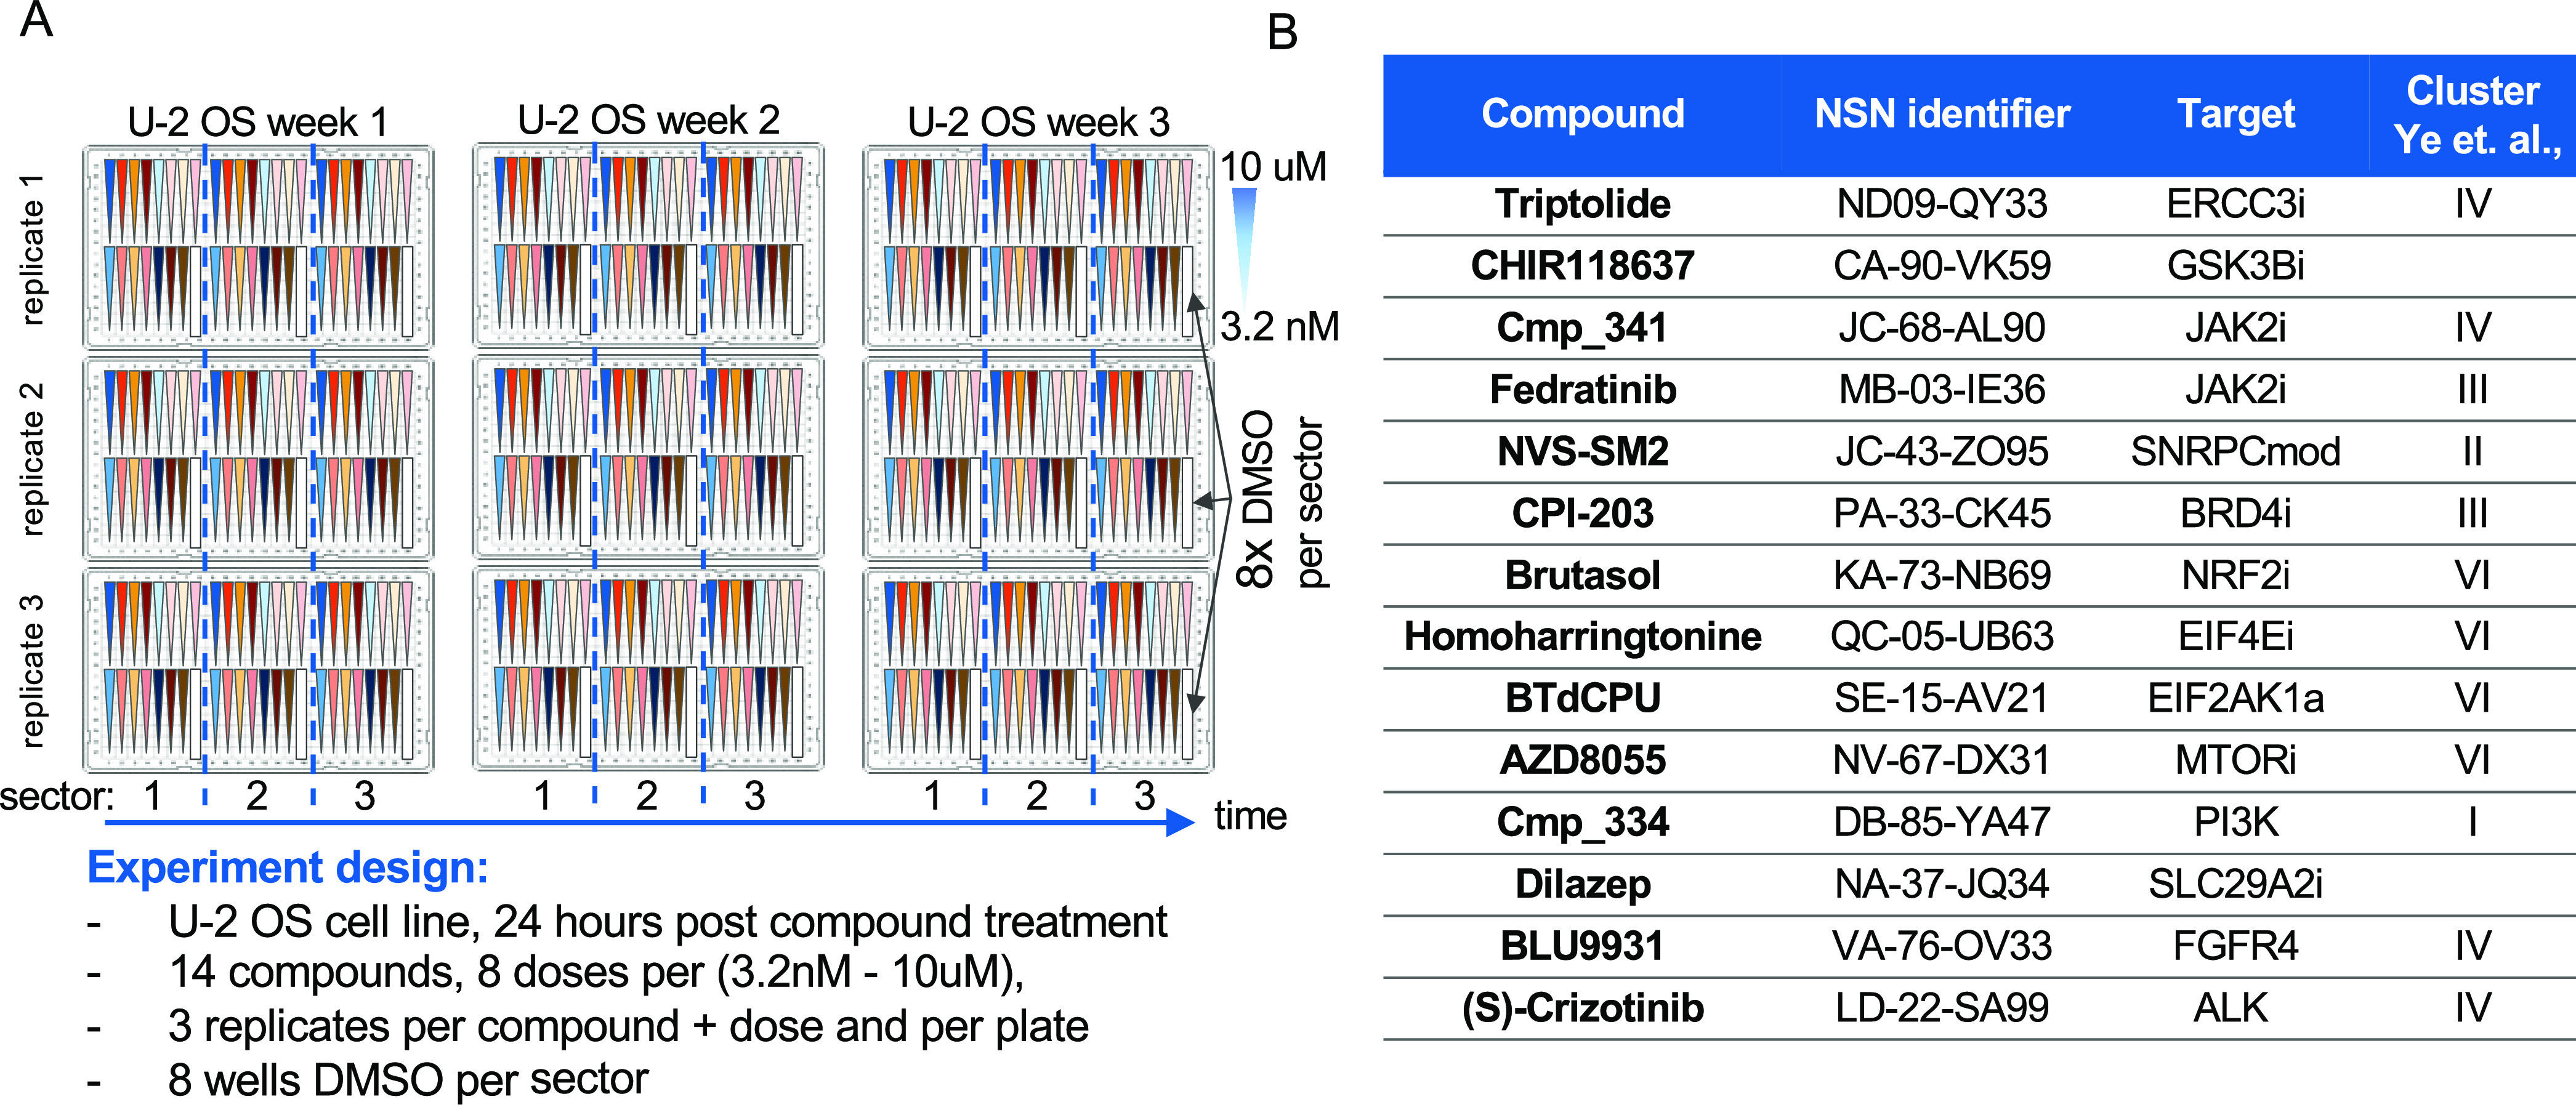
DRUG-seq reproducibility experimental design. (A) Experimental design depicted by nine plate maps. Within each plate, 14 compounds were plated in 8 doses (3.2 nM to 10 μM) in 3 sectors for a total of 3 replicates per condition per plate (n = 3 per condition). Each sector contained 8 DMSO wells for a total of 24 per plate (n = 24). For each week (or batch) of cells, there were three replicate plates. Each batch of cells was plated on independent days to reflect biological variability. (B) Table depicts compound name, identifier, target, and cluster from Ye et al., 2018 publication. Fourteen compounds were selected to represent a diverse set of MoAs.
Table 1. Fourteen Compounds.
| compound | NSN identifier | target | Ye et al., 2018 |
|---|---|---|---|
| triptolide | ND-09-QY33 | ERCC3i | IV |
| CHIR118637 | CA-90-VK59 | GSK3Bi | |
| Cmp_341 | JC-68-AL90 | JAK2i | IV |
| fedratinib | MB-03-IE36 | JAK2i | III |
| NVS–SM2 | JC-43-ZO95 | SNRPCmod | II |
| CPI-203 | PA-33-CK45 | BRD4i | III |
| brutasol | KA-73-NB69 | NRF2i | VI |
| homoharringtonine | QC-05-UB63 | EIF4Ei | VI |
| BTdCPU | SE-15-AV21 | EIF2AK1a | VI |
| AZD8055 | NV-67-DX31 | MTORi | VI |
| NVP-BVB808/Cmp_334 | DB-85-YA47 | PI3K | I |
| dilazep | NA-37-JQ34 | SLC29A2i | |
| BLU9931 | VA-76-OV33 | FGFR4 | IV |
| (S)-crizotinib | LD-22-SA99 | ALK | IV |
DRUG-seq Analysis Pipeline and Activity Threshold
The data processing and primary analysis pipeline is a series of manually run steps, which allow for stepwise review and quality control. After sequencing, reads are demultiplexed using Illumina’s standard bcl2fastq2 method. The upstream DRUG-seq data processing employs highly parallelized mapping, as well as barcode and UMI counting and filtering to efficiently generate count tables (Figure 3A). Mapping of sequencing reads is performed using a custom version of the Ensembl GRCh38 reference, in which each gene was constructed using all annotated exons.
Figure 3.
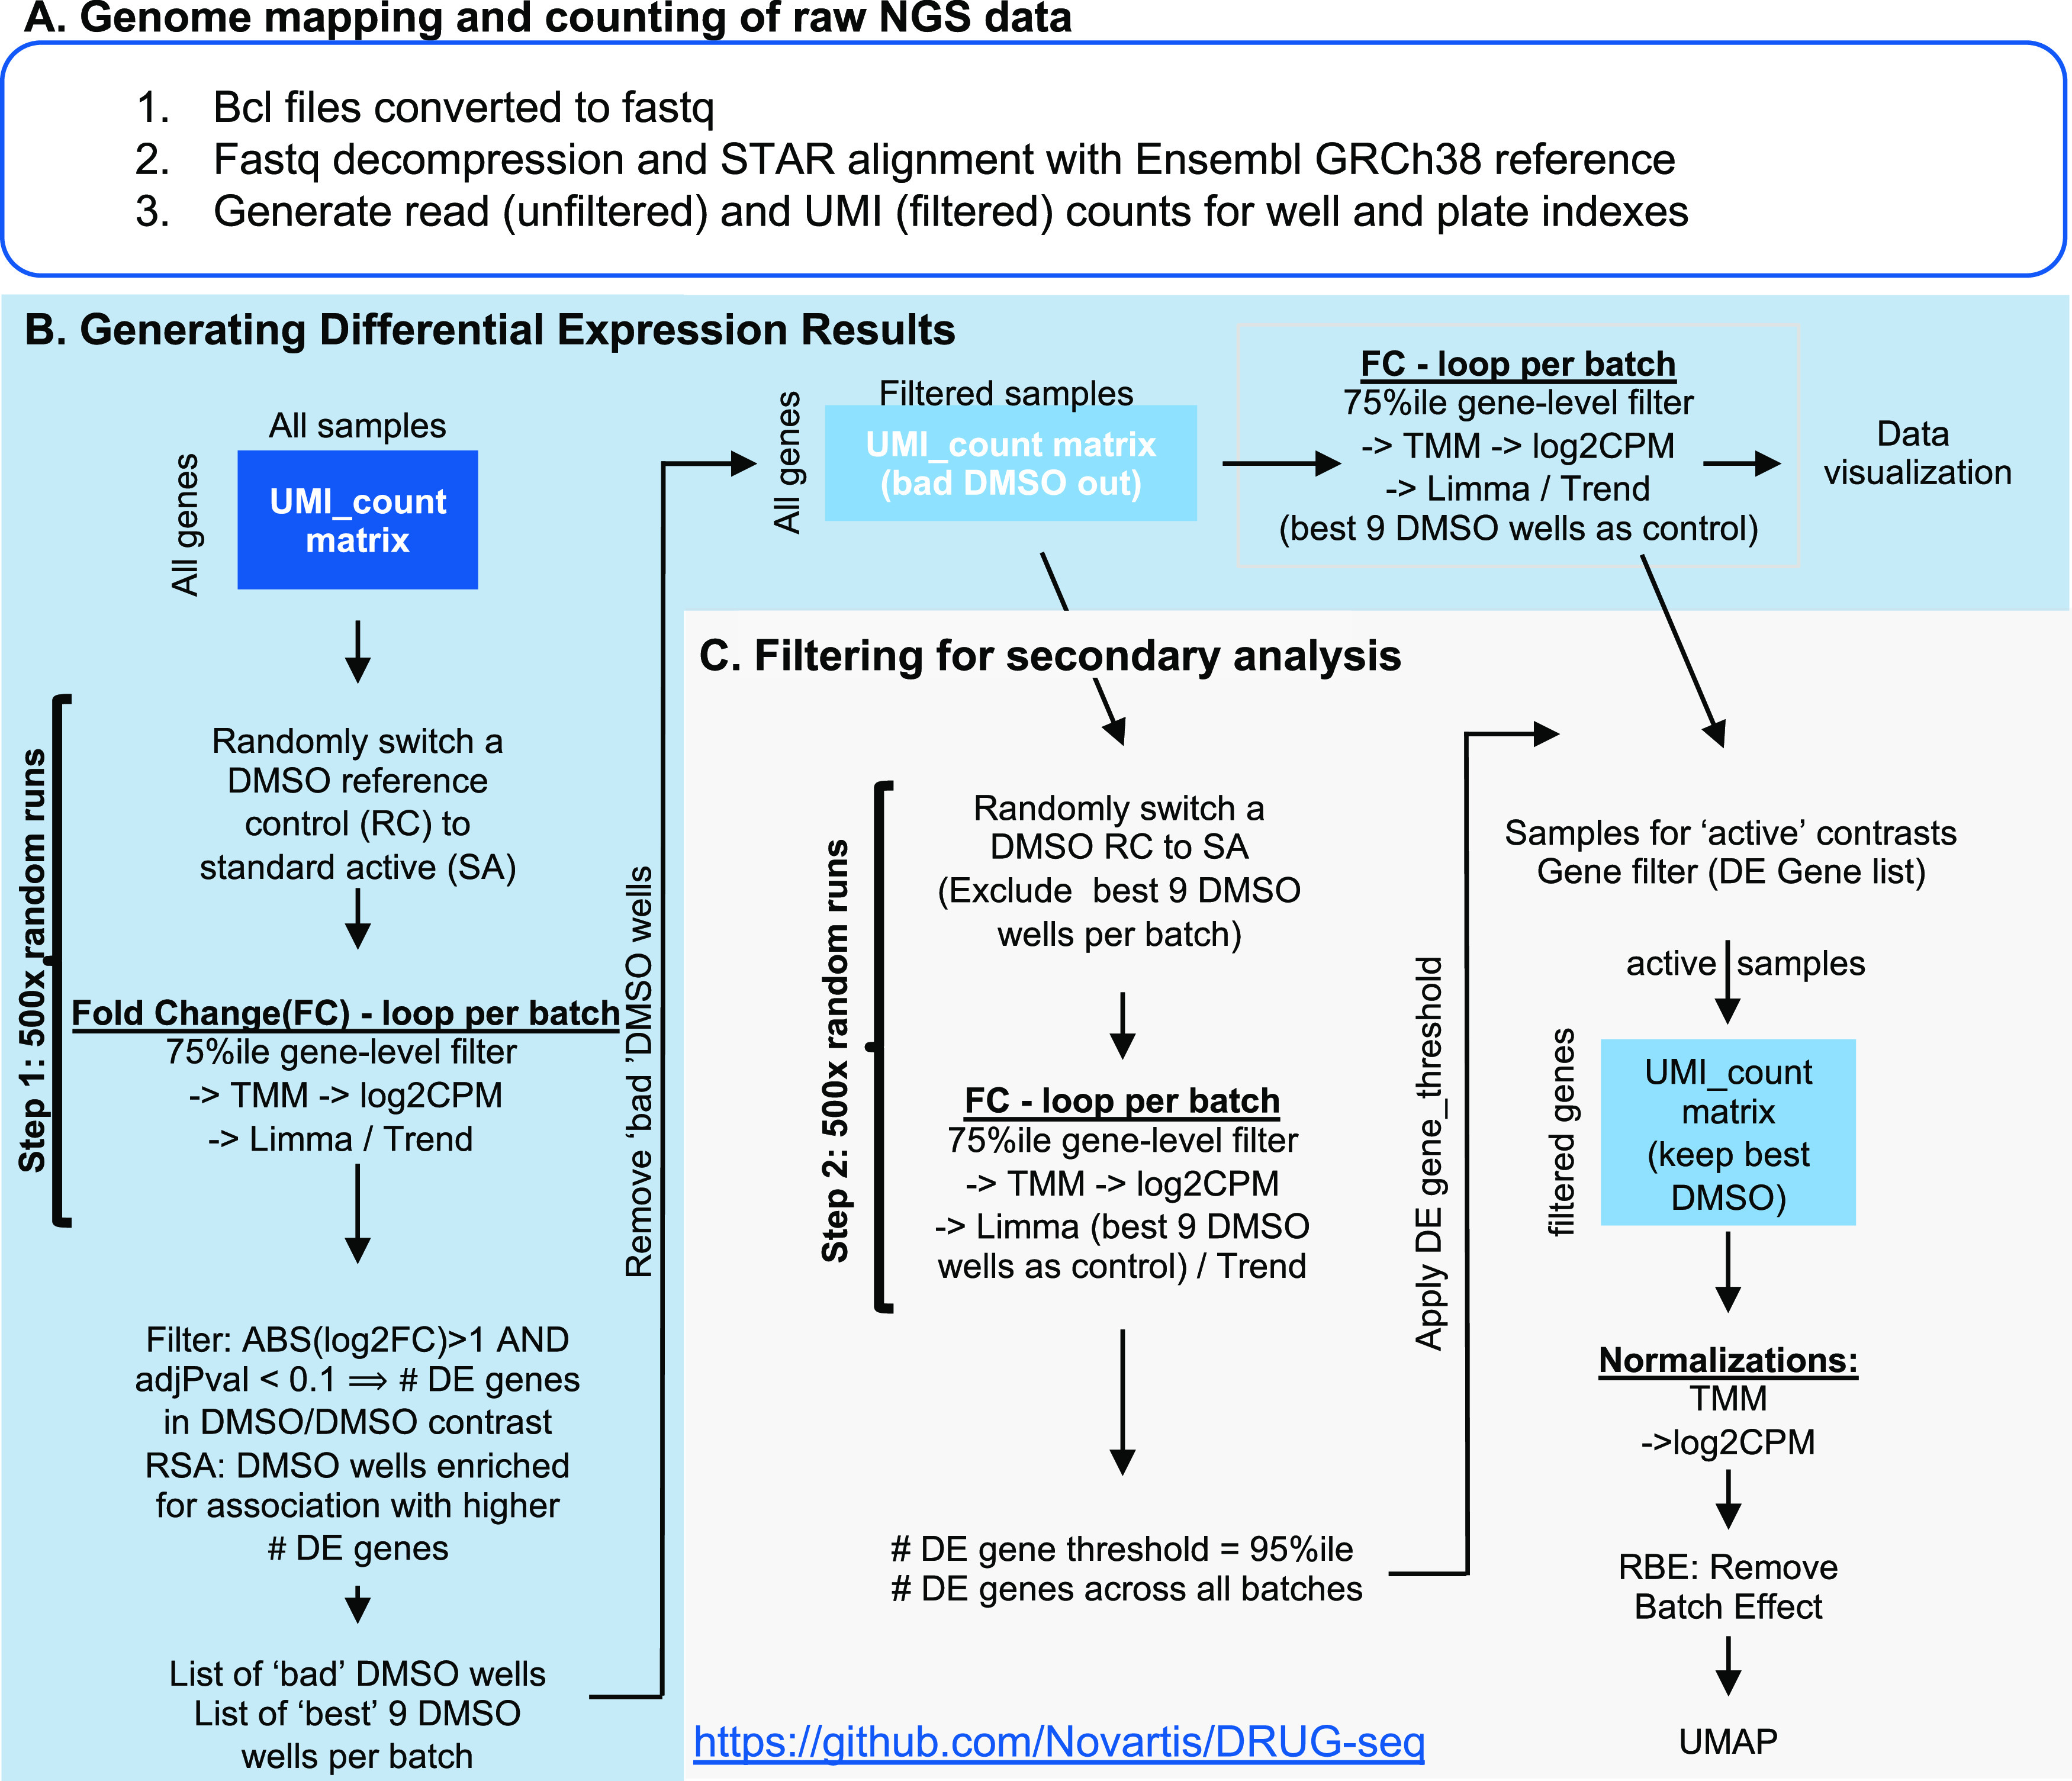
DRUG-seq analysis pipeline. The DRUG-seq analysis pipeline is composed of three steps (A) outline of the steps required to convert raw next-generation sequencing data into a count matrix by converting to fastq files, aligning to the transcriptome and counting transcripts associated with well and plate barcodes. (B) Flow chart describing how differential expression (DE) results are obtained from the UMI count matrix generated in part A. In step 1, the true null is calculated by performing 500 random DMSO to DMSO comparisons to generate DE results. Next, RSA analysis is used to rank DMSO wells by the number of DE genes they contributed to. Bad DMSO wells are removed and the nine best DMSO wells are used as reference controls (RCs) to calculate a differential expression for the compound-treated wells. (C) Flow chart describing the filtering steps required for secondary analysis. Step 2 of the true null calculation is performed and 500 random DMSO to DMSO comparisons generate DE gene results in the absence of bad wells. The 95th percentile of the 500-comparison distribution is then used as an activity threshold. The threshold is the minimal number of DE genes required to be greater than the technical noise in DMSO 95% of the time. The true null activity threshold is used to filter active samples. DE gene filtering, normalization, and removal of batch effects are applied to generate the final UMAP visualization.
The following steps of the analysis code are shared through GitHub (https://github.com/Novartis/DRUG-seq). Before generating differential expression (DE) results, an activity threshold is empirically determined based on the technical noise of the experiment and is coined the “true null calculation.” This takes advantage of the high number of DMSO wells that can be sampled in this low-cost RNA-seq assay. The baseline for transcriptionally active treatments is set by performing multiple permutations of randomly sampled DMSO vs DMSO comparisons using all available wells (step one). In step 1, for each batch of three plates, three random DMSO wells were selected (one per plate) and were compared to the remaining 69 DMSO wells to then calculate DE. This process was iterated 500 times (Figures 3B and 4A, File S2). Out of the 500 iterations, we identified both DMSO wells that contributed to the fewest DE genes and DMSO wells that contributed to the most DE genes using the redundant siRNA activity (RSA) statistic.14 The nine DMSO wells per batch (three per plate) that contributed to the fewest DE genes were then used as reference controls to calculate DE for the compound-treated samples (Figure 3B). It should be noted that the number of iterations, as well as the number of DMSO wells chosen for an optimal reference control, can be customized for each experiment. Next, we carry out DE analysis using limma-trend15 to quantitate gene-level changes in the transcriptome, which can serve as the input for additional analyses (Figure 3B).
Figure 4.
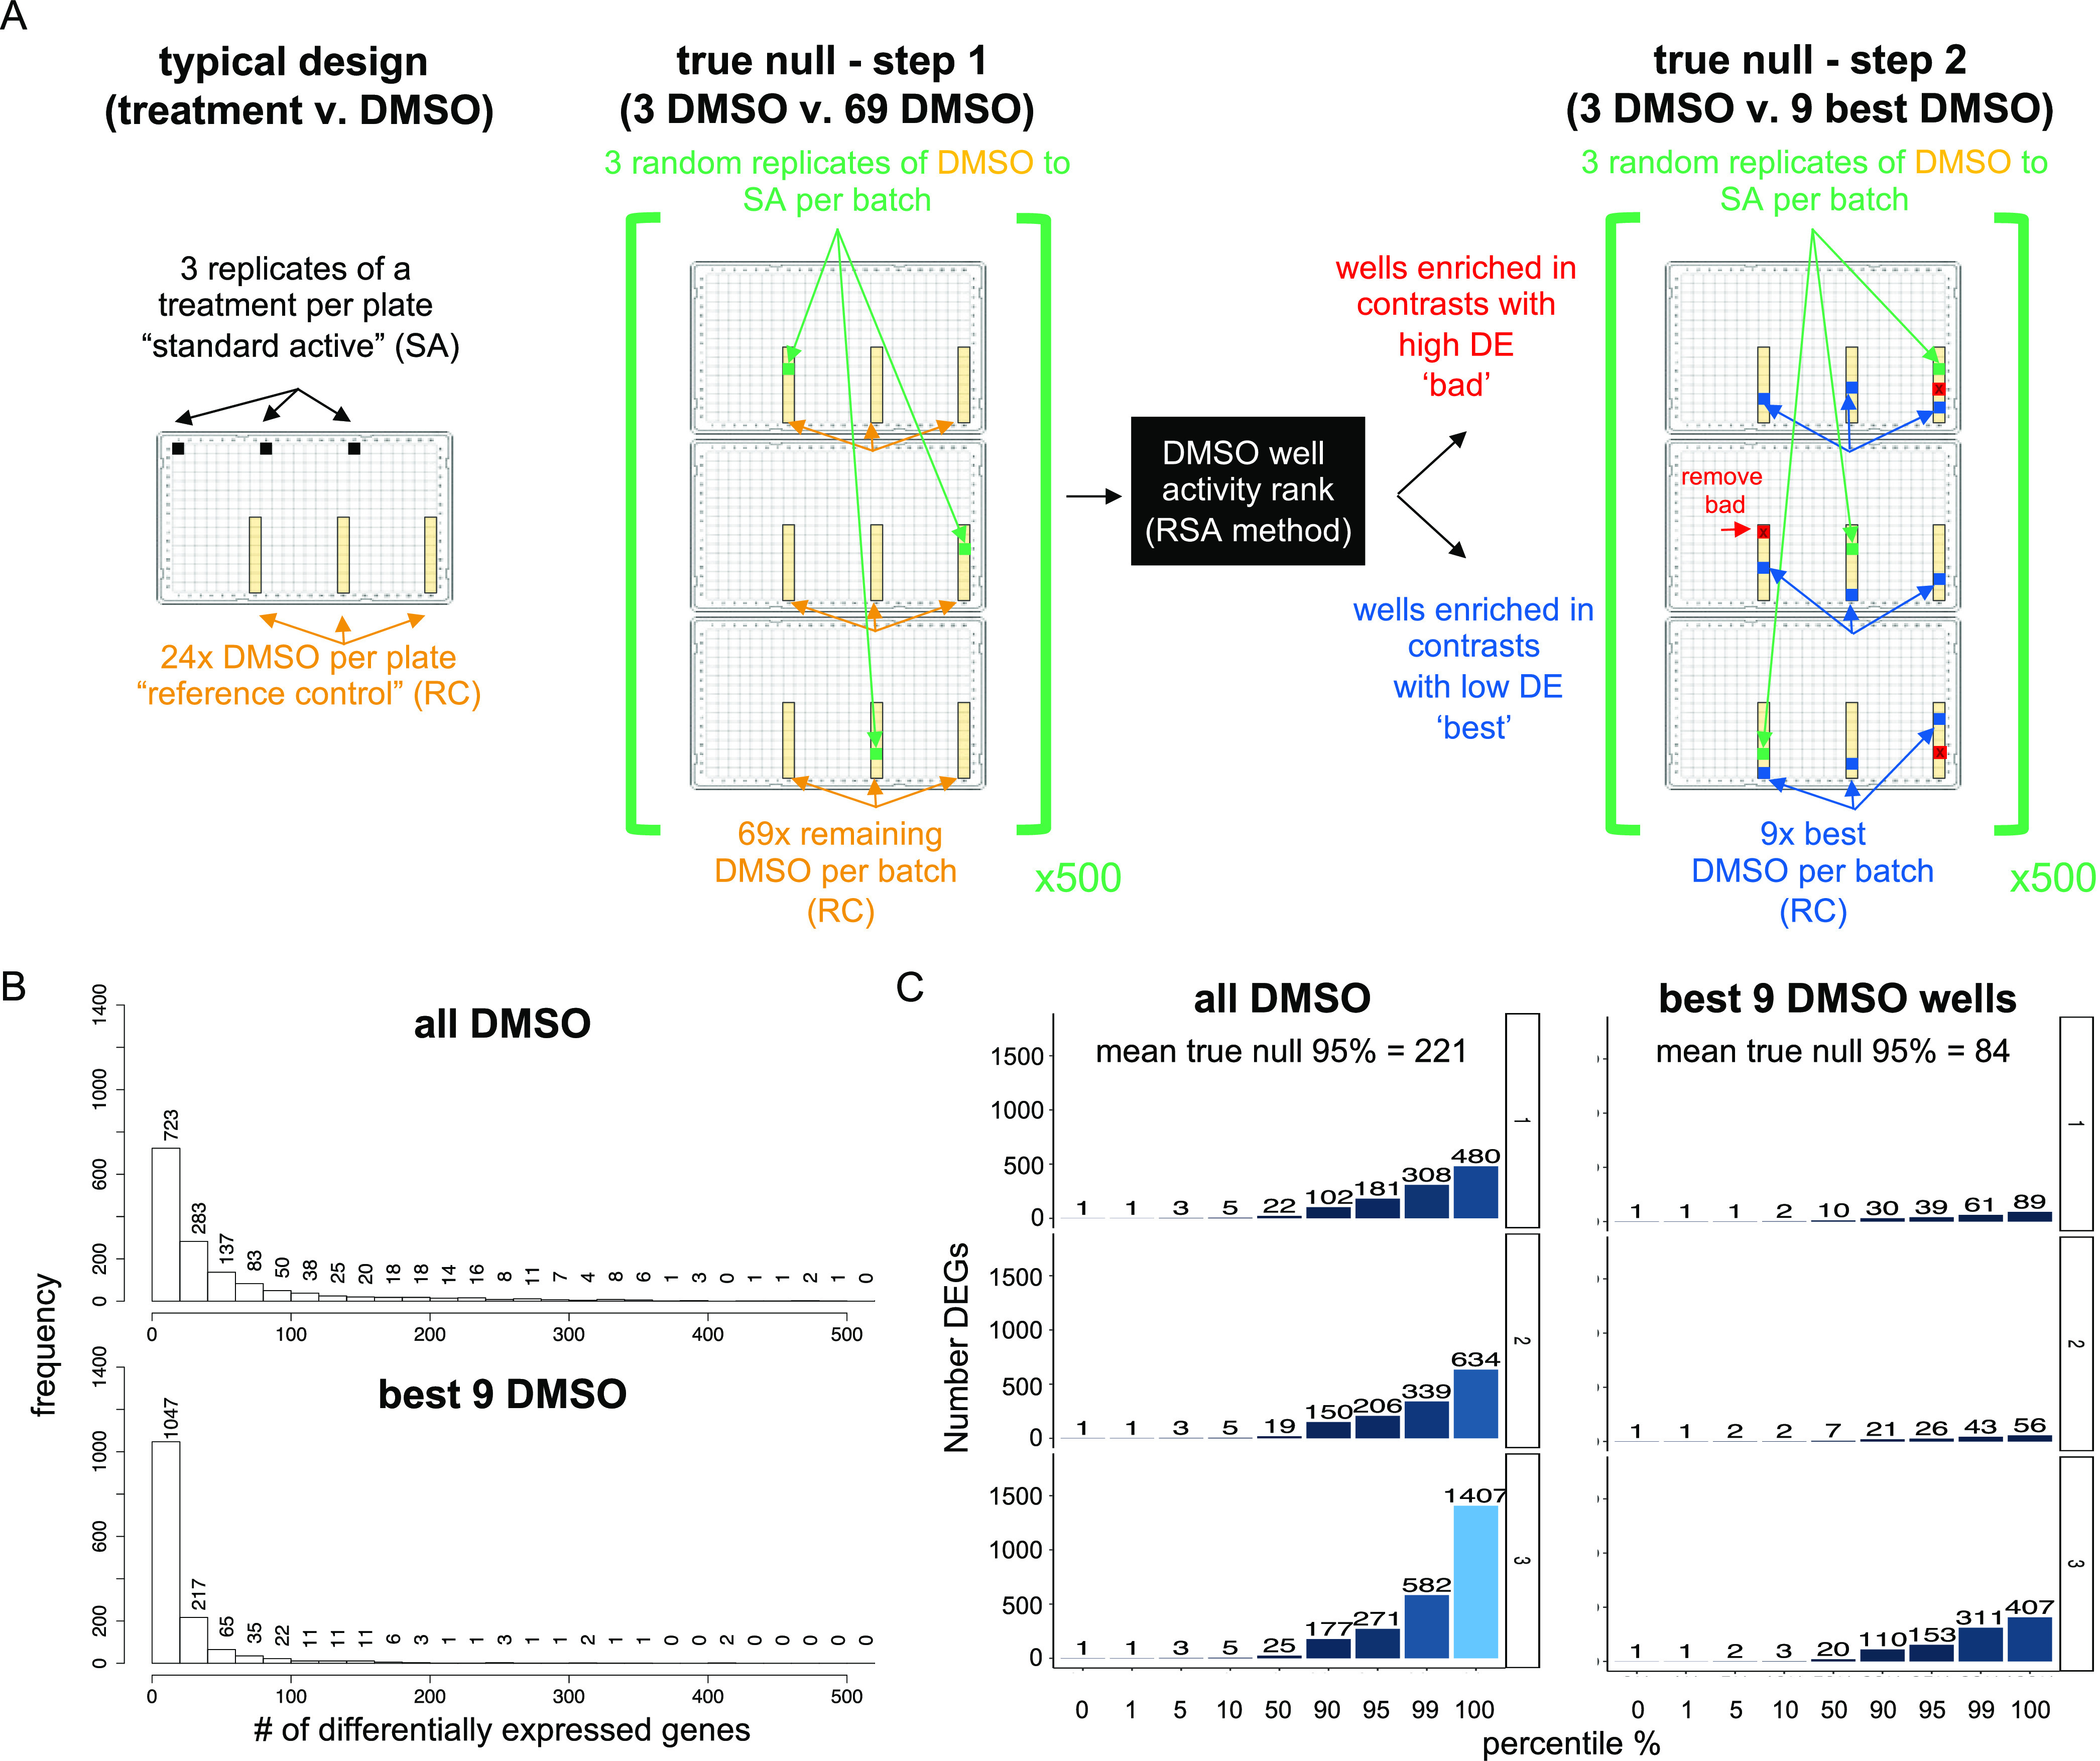
DRUG-seq activity threshold set by the true null calculation. (A) Left panel depicts the typical analysis of a DRUG-seq experiment using compounds with DMSO as a control. When setting a contrast for DE analysis, three replicates of a standard active (SA) sample (compound plus dose, colored black) are compared to the DMSO reference controls (RC, colored gold). Each compound treatment has 3 SA well replicates and 24 RC or DMSO well replicates per plate. The middle panel depicts step 1 of the true null calculation. For this, the number of differentially expressed genes is quantified when comparing three DMSO well replicates as mock treatments (DMSO/RC turned SA wells, green) relative to the remaining 69 DMSO/RC (gold) wells per batch of three plates. Five hundred randomly chosen differential expression comparisons of 3 DMSO versus the remaining 69 DMSO are performed. Next outlier DMSO wells (colored red) and the best DMSO wells (colored blue) are identified using the redundant siRNA activity (RSA) statistical ranking analysis. The right panel depicts step 2 of the true null calculation. Five hundred random DMSO to DMSO differential expression comparisons are recalculated, this time in the absence of the bad DMSO wells with the nine best DMSO as the RC. (B) Histogram shows the frequency of the number of DE genes per comparison of randomized DMSO SA to DMSO RC comparisons. In step 1, all DMSO wells are compared (top), and in step 2, the bad DMSO wells are removed and the randomly chosen DMSO wells are compared to the best nine DMSO wells (bottom). Y-axis is the frequency of the 500 DMSO comparisons, across 3 batches, binned by the number of differentially expressed genes on the X-axis. (C) Bar graph plots the number of DE genes (y-axis) against the percentile from the distribution of 500 randomized DMSO to DMSO comparisons per batch of three plates. The left panel depicts true null calculated using all DMSO wells (step 1) and selected a mean threshold of 221 differentially expressed genes (DEG) at a 95th percentile. Depicted on the right panel is the true null calculation using removing the outlier DMSO wells across three plates (mean 84 DEG at the 95th percentile). The result is interpreted as only 5% of the time DEGs in DMSO are above the noise detected by comparing DMSO treatments. Removing the outlier DMSO wells for analysis lowers the threshold per batch. Light blue is 1407 DEGs and dark blue is 1 DEG.
In step 2, DMSO wells that potentially inflate the number of DEGs were removed (“bad” wells marked red, Figures 3C and 4A). The true null was recalculated by comparing three random DMSO wells versus the nine best DMSO wells with 500 iterations, where we selected the three random wells from the remaining DMSO wells (Figures 3C and 4A, File S3). When comparing the results from steps 1 and 2, the frequency of DMSO to DMSO comparisons yielding more than 100 DE genes was reduced with reciprocal gains in the frequency of DMSO comparisons with 20 or fewer DE genes (Figure 4B). We typically define transcriptionally active compounds as those with more DE genes than the 95th percentile of the DMSO to DMSO true null distribution (Figures 3C and 4C). This indicates that the treatment is more active than DMSO, 95% of the time. Results obtained with all DMSO wells (Step 1: active >221 DE genes) have a higher number of DE genes (Figure 4C). Results obtained by removing outlier DMSO wells (Step 2: active >84 DE genes), lowered the minimal number of DE genes to be considered active (Figure 4C). The step 2 true null threshold to filter active samples for the results is discussed below. The secondary analysis pipeline integrates count table data and experimental metadata for quality control and batch correction analyses. In addition to the true null (step two), gene-level thresholds are applied to reduce technical variation. Dimensionality reduction analysis by Uniform Manifold Approximation and Projection (UMAP)16 is then performed to globally visualize the data.
Batch and Plate Reproducibility Experiment with 14 Tool Compounds
After using the true null threshold to select for active treatments, we used the secondary analysis pipeline and generated a UMAP from the DRUG-seq UMI counts matrix to visualize the global relationship between the 14-compound treatments across an active dose range (Figure 5A). After labeling the UMAP by either Louvain cluster number17 or compound treatment, it was evident that DRUG-seq identified many transcriptional groups. The 13 Louvain clusters were spatially distinct in the UMAP plot and often displayed substructures in the UMAP projection. We next examined how each compound was distributed across the UMAP and identified that the majority (12 of 14) of compounds were localized in a compound-specific cluster (Figure 5B, File S4, interactive plot). Dilazep and (S)-crizotinib were the exception, as these two compounds clustered near DMSO, suggesting low activity in the U2-OS cell line. Some compounds exhibited a single cluster at a certain dose range like BLU9931, CPI-203, CHIR118637, and Cmp_341. For most compounds, dose influenced the clustering and we observed dose-specific clusters for triptolide, homoharringtonine, brusatol, NVS–SM2, fedratinib, Cmp_334, and AZD8055. These compounds may exhibit polypharmacology, and the targets they engage either change and/or interact across doses. However, validation would be required to confirm these multitargeted transcriptional activities. We observed coclustering of compounds with related MoAs. For example, the translational inhibitors homoharringtonine and brusatol exhibited matched dose-dependent clustering, which reflects similar potencies and targets. Cmp_334, a PI3K inhibitor, and AZD8055, an mTOR inhibitor, exhibit a shared cluster at low doses that diverge with increasing concentration. This is not surprising given that PI3K is the upstream of mTOR,18 and perhaps both compounds have selective effects at the lower doses, while a broader range of scaffold-related activity is induced at higher doses. In addition to this descriptive analysis, we quantified cluster composition across batches. We used the Louvain method to define 13 clusters and generated a heatmap to indicate the proportion of each active compound treatment within the Louvain clusters per each batch (Figure 5C). Each compound exhibits an enrichment in a specific Louvain cluster, and the same result was observed across the three batches of cells. This indicates high reproducibility despite both technical and biological variation. Overall, these results indicate that DRUG-seq has sufficient resolution to group compounds by MoA, and because it is target agnostic, it can detect many MoAs in a single assay.
Figure 5.
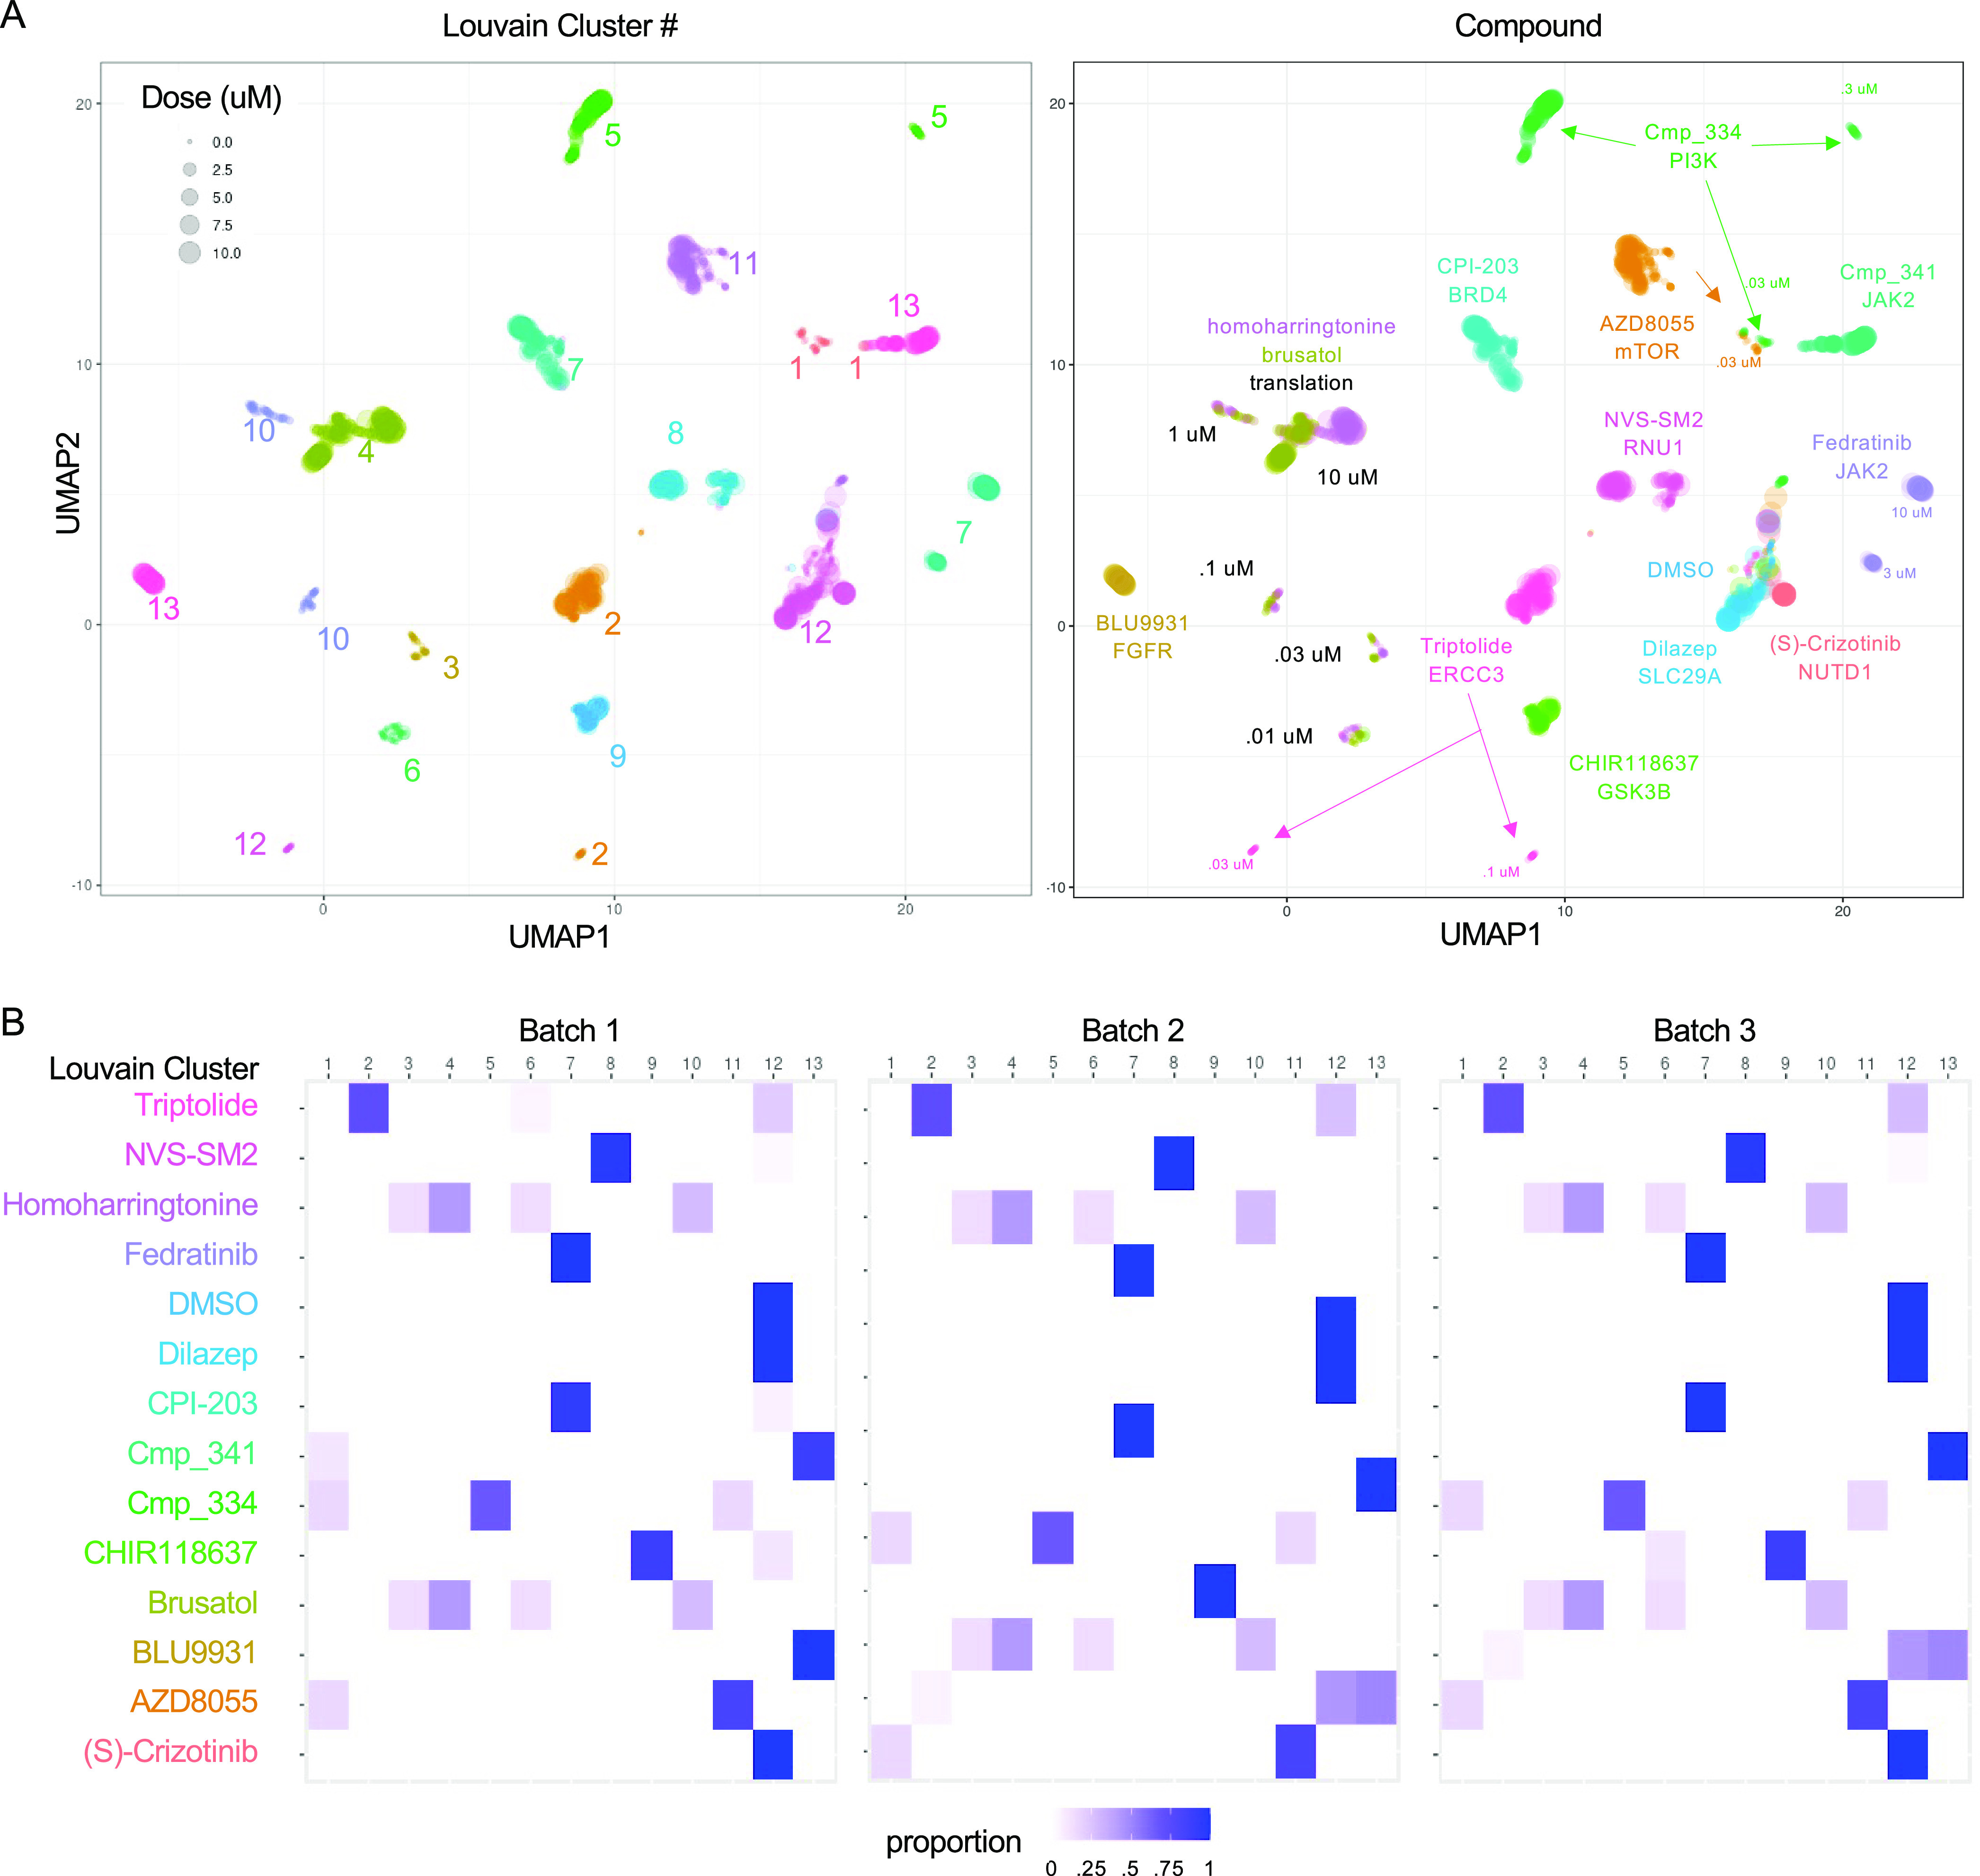
Reproducibility of DRUG-seq data using a set of diverse MoA compounds. (A, B) UMAP plots depicting a dimensionality reduced 2D transcriptome using DRUG-seq data colored by Louvain cluster number for (A) and colored by compound ID for (B). The 14 compounds represent a diverse set of MoAs and only active treatments above the true null threshold are plotted and form distinct clusters. Brusatol and Homoharringtonine are both translation inhibitors and cocluster. DMSO wells are included for an activity reference. Compounds with subtle effects cluster near DMSO. Each dot represents a single well for each treatment. The size of dots is scaled to represent doses from 0 to 10 μM. On the left and right panels, each compound or Louvain cluster, respectively, is labeled by text in the color of the corresponding dots. (C) Heatmap indicates the proportion of each compound-treated sample within Louvain clusters 1–13. Most compounds have a predominant composition in a single or a few Louvain clusters. Cluster 12 includes DMSO and has a mixed composition of many compound and dose combinations of weaker effects. Results across three independent batches of cells show a similar composition indicating reproducibility despite biological and technical variation. Proportion for each cluster is indicated with a color (scale 0 = white and 1 = dark blue).
Next, the reproducibility of single compounds across doses was examined. Comparing a single dose of homoharringtonine at 10 μM across all three batches revealed an average overlap of 68%, which is close to the expected overlap with a false discovery rate threshold of 0.1 (Figure 6A). Homoharringtonine exhibited a dose response and high overlap of DEGs across consecutive doses (Figure 6B,C). Within a batch, adjacent doses 1, 3.16, and 10 μM exhibited an average of 82% overlap in differentially expressed genes (Figure 6C). We performed a pairwise comparison across all doses and identified a high Pearson’s correlation between samples within a batch. Higher doses and adjacent doses exhibited the highest correlations (0.8–0.98) (Figure 6D). Overall, these studies represent a high bar for vetting the stability of a platform and will allow for comparisons with emerging technologies. We deposited the NGS data, metadata, and analysis code for this study to enable other teams to reproduce the transcriptome signatures and to use in additional benchmarking studies.
Figure 6.
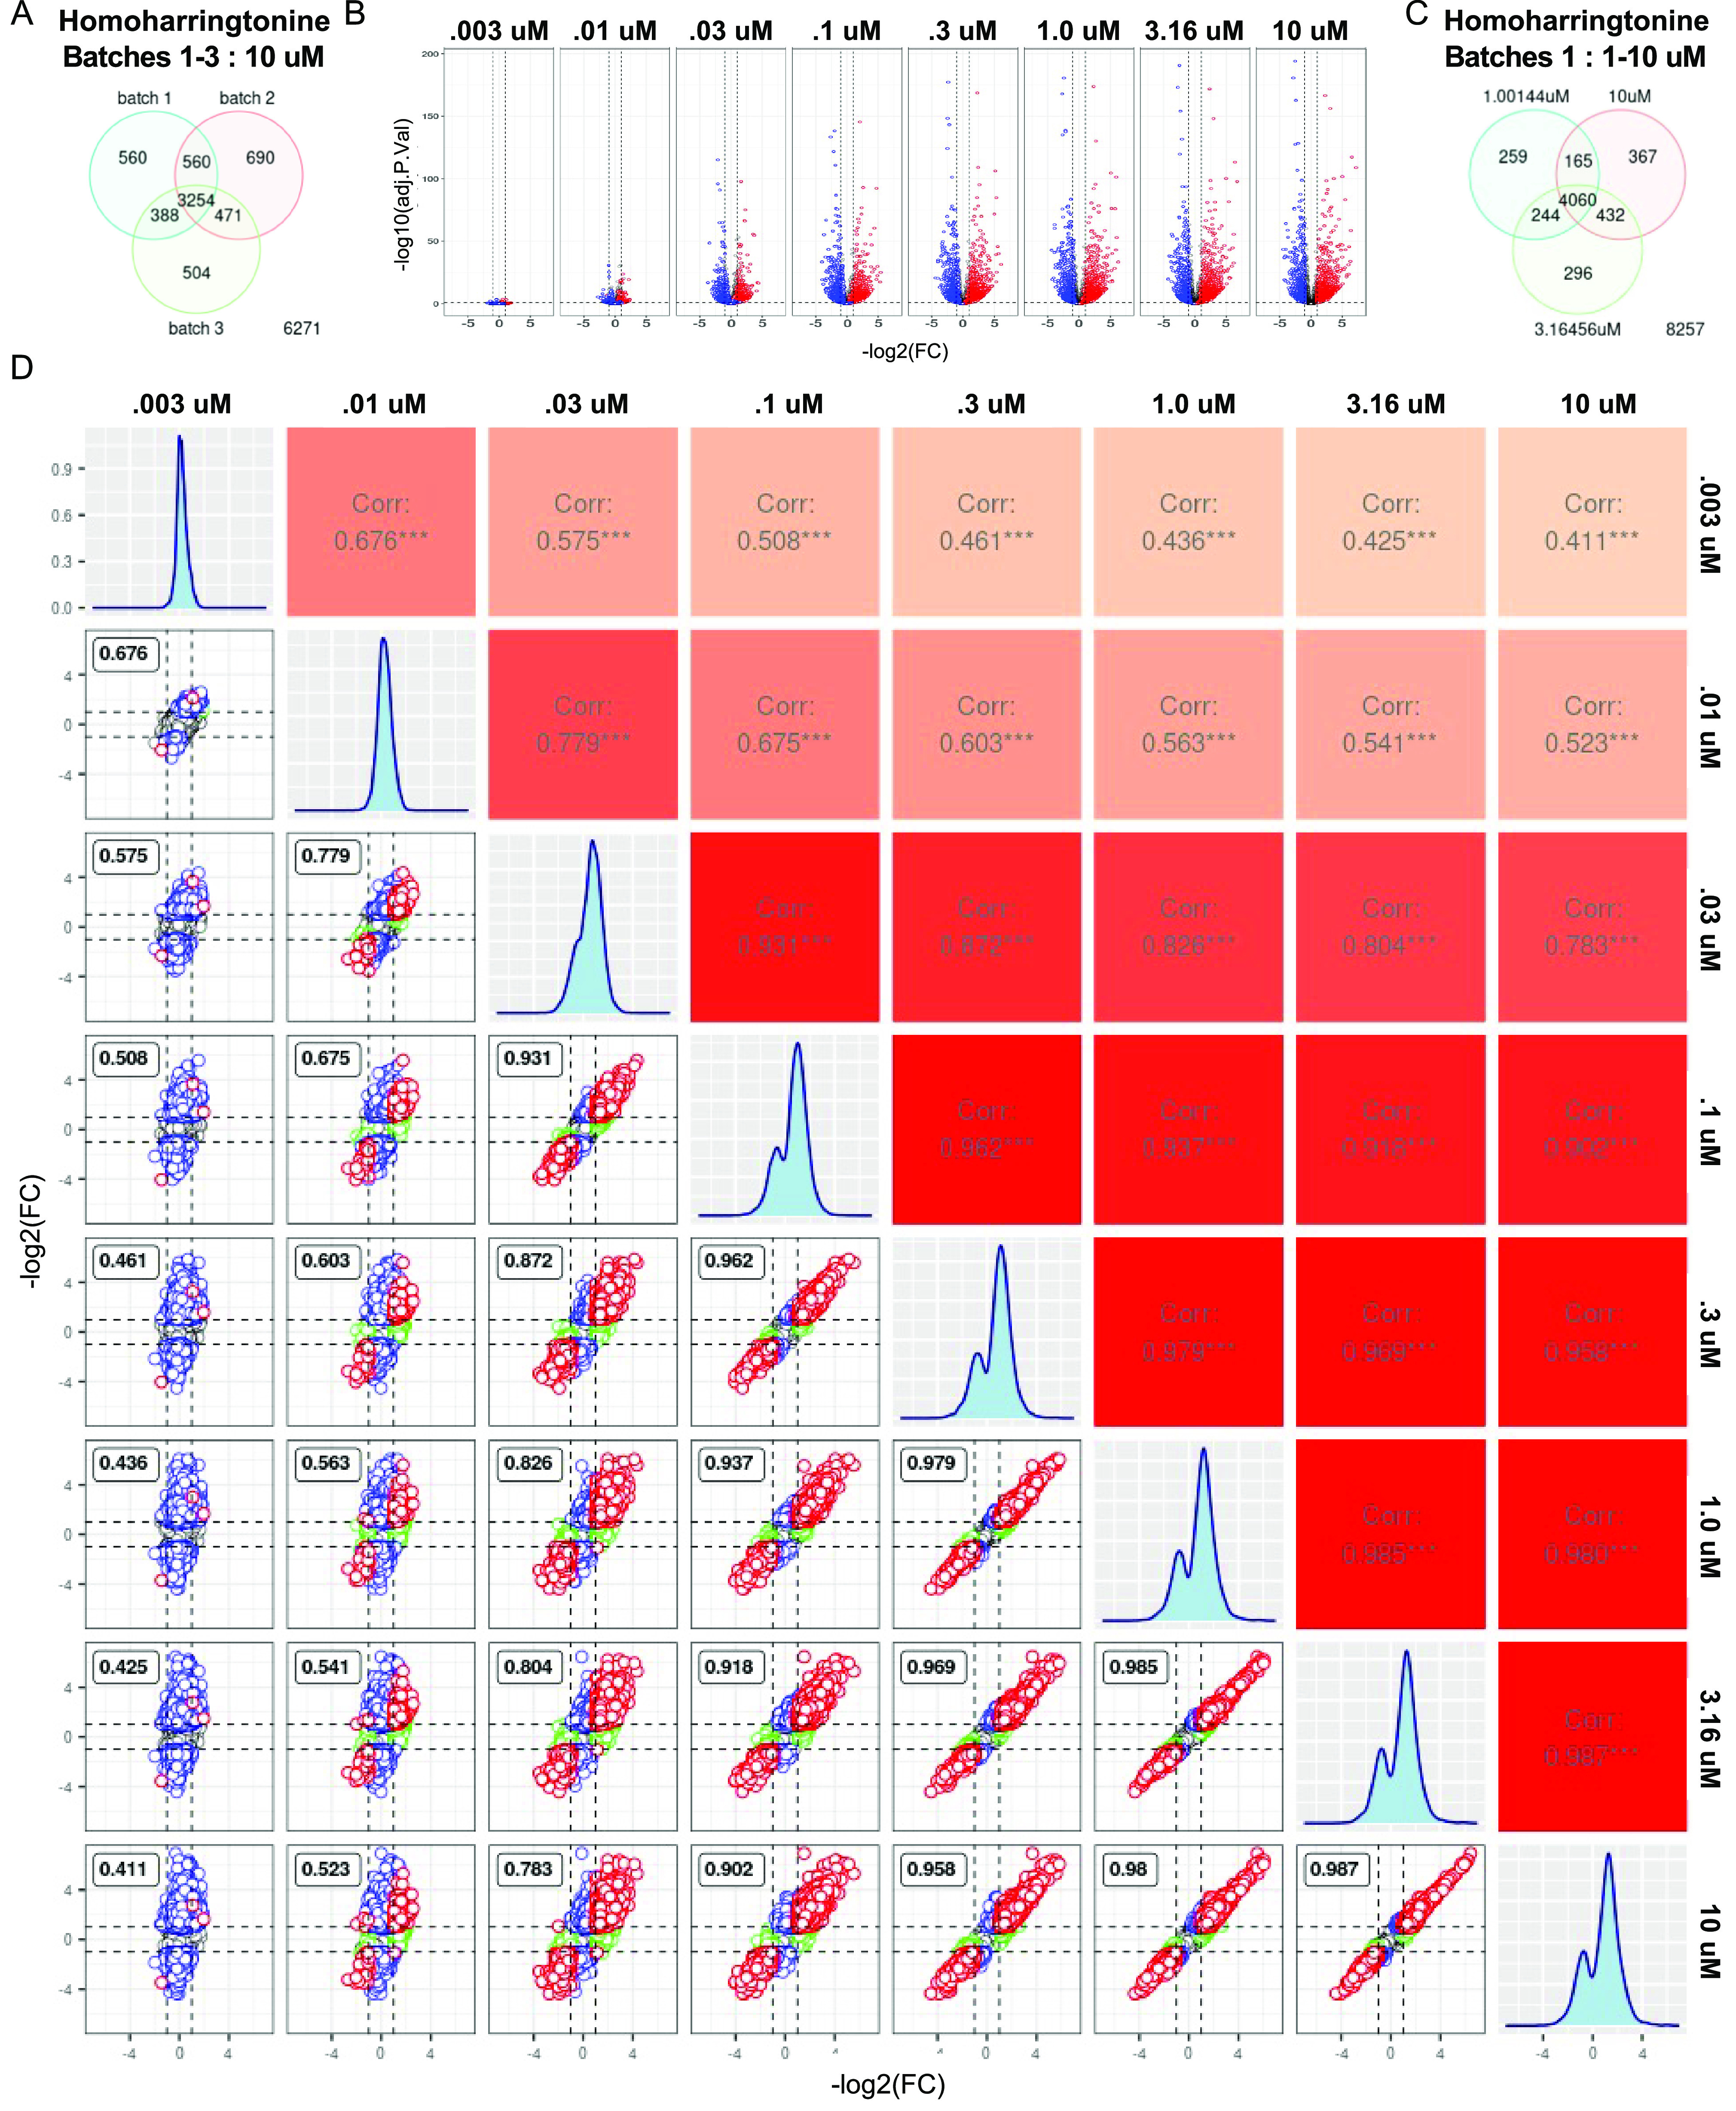
Dose response and batch reproducibility of Homoharringtonine. (A) Venn diagram showing overlapping differentially expressed genes across batches 1–3 at 10 μM dose. (B) Volcano plots depicting dose response for homoharringtonine. Y-axis adjusted p-value, X-axis log2(FC). Red = upregulated genes in 10 μM, Blue = downregulated genes in 10 μM, and n.s. = not significant in 10 μM (significant = adj.p<0.5 +/- 1 log2FC). (C) Venn diagram depicting the overlap of differentially expressed genes between adjacent doses 1–10 μM. (D) Pair plot comparing all doses. The top right half indicates Pearson’s correlation between samples. Color scale from white = 0 to red = 1. Bottom left scatter plots pairwise compare log2(FC) in gene expression from conditions labeled on the top and right edges. The dashed lines label log2(FC) threshold equal to 1. Red indicates common DEGs across conditions. Blue are DEGs specific to condition on the y-axis and green are DEGs the x-axis for each comparison. The histogram on the diagonal depicts the distribution of gene expression for each condition.
DRUG-seq Detects On- and Off-Target Effects for NR2A Drug Discovery Program
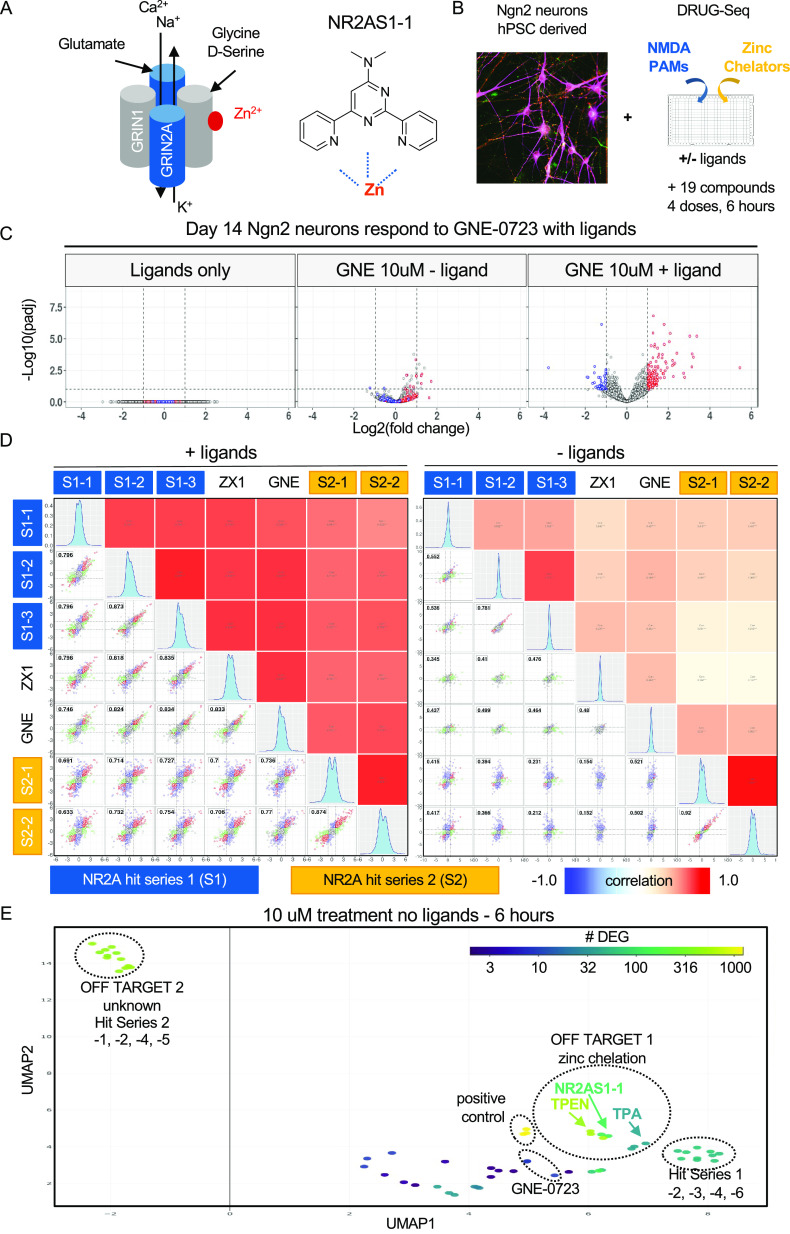
To demonstrate the applicability of DRUG-seq, we describe an example from a neuroscience drug discovery program aimed at developing therapeutics for schizophrenia (Figure 7). Schizophrenia afflicts approximately 1% of the population.19 NMDA receptor (NMDAR) hypofunction is implicated in schizophrenia,20,21 and the gene encoding the NR2A subunit, GRIN2A, is associated with schizophrenia risk, as evidenced by genome- and transcriptome-wide association studies and rare de novo mutations, all of which can modify disease risk.22−25 The NMDA receptor is heterotetrameric with many subunits, and among the possible combinations, it can be composed of two dimers of GRIN2A and GRIN126 (Figure 7A). The NMDA receptor functions as an ion channel that opens in the presence of its ligands, glutamate, glycine/D-serine, and NMDA.27 Furthermore, the channel can be inhibited by phencyclidine (PCP), ketamine, dizocilpine (MK-801), and zinc.27 Screening campaigns identified two independent chemical scaffolds (hit series 1 and 2) as novel NR2A potentiators. Examination of the structure of one of these scaffolds, NR2AS1-1, indicated a potential to chelate zinc (Figure 7A). Although this could be part of the on-target MoA by removing zinc from the extracellular surface of NMDAR to potentiate receptor activity,28,29 it also presents potentially undesirable pharmacology by chelating zinc, an essential ion with many biological functions.30−32
Figure 7.
DRUG-seq detects on- and off-target effects for NR2A Drug Discovery Program. (A) Schematic depicting an idealized heterotetrameric NMDA receptor composed of two dimers of GRIN2A and GRIN1. The presence of ligands glycine/D-serine and glutamate trigger the release of ions. Zinc ions bind and inhibit channel function (red). The chemical structure of NR2AS1-1 revealed a potential to chelate zinc (Zn2+). (B) Experimental paradigm combines human Ngn2 neurons with both an on-target NMDA positive allosteric modulator (PAM) and off-target zinc chelators. Neurons were treated for 6 h in the absence or presence of ligands. (C) Volcano plots depicting ligand-dependent differential expression of genes induced by the NMDA PAM GNE-0723. Y-axis −log 10 (adjusted p-value); X-axis log 2 (fold change). Red = upregulated differential expressed genes in 10 μM, blue = downregulated differential expressed genes in 10 μM, and n.s. = not differential expressed genes in 10 μM (differential expression = adj.p<0.1 and abs(log2FC)>1). (D) Pair plot comparing tool compounds (GNE-0723 and ZX1) to both NR2A hit series 1 and 2. The top right half indicates Pearson’s correlation between samples. Color scale is blue = −1, white = 0, and red = 1. Bottom left scatter plots pairwise comparison of log2(FC) in gene expression from conditions labeled on the top and right edges. The dashed lines label log2(FC) threshold equal to 1. Red indicates common DEGs across conditions. Blue shows DEG specific to condition on the y-axis and green is DEG the x-axis for each comparison. The histogram on the diagonal depicts the distribution of gene expression for each condition. (E) UMAP projection of the DRUG-seq transcriptome for active compound treatments without ligands. NR2AS1-1 clusters with the zinc chelators TPEN and TPA. Other compounds from hit series 1 and GNE-0723 do not cluster with zinc chelators. Compounds from hit series 2 are very active without ligands and exhibit a second off-target effect caused by an unknown mechanism.
To study both on- and off-target effects, we performed DRUG-seq profiling of human pluripotent stem cell (hPSC)-derived neurons treated with our two internal hit series of NR2A potentiators (Figure 7B and Table 2). We compared these to neurons treated with the extracellular zinc chelator ZX1, the cell-permeant zinc chelators TPEN and TPA,33−35 and GNE-0723, a selective NR2A NMDAR positive allosteric modulator.36 In the presence of NMDAR ligands (NMDA and D-serine) alone, we saw no DE genes (Figure 7C). In iPSC-derived neurons,37 we observed a transcriptional response to GNE-0723 that was enhanced by ligands (Figure 7C). In the presence of ligands, we detected a similar NMDAR activation signature in neurons treated with five additional compounds (NR2AS1-1, -2, and -3; NR2AS2-1 and -2) from the two independent potentiator hit series scaffolds (Figure 7D), with correlations ranging from 0.736 to 0.834. As expected, the extracellular zinc chelator ZX1 produced a similar signature to the NR2A potentiators, presumably by inhibiting the repressive effect of extracellular zinc binding on NMDAR signaling (Figure 7D). Cumulatively, we identified seven compounds that induced an NMDAR activation signature from four distinct chemotypes.
Table 2. NR2A On- and Off-Target Compounds.
| ID | InChIKey | description |
|---|---|---|
| NR2A_DRUG-PC1 | DFBIRQPKNDILPW-KTGKZQHOSA-N | triptolide—Drug-Seq control |
| NR2A_DRUG-PC3 | Drug-Seq control | |
| TPA | VGUWFGWZSVLROP-UHFFFAOYSA-N | TPA |
| TPEN | CVRXLMUYFMERMJ-UHFFFAOYSA-N | TPEN |
| ZX1 | AXBINWBONNNKDF-UHFFFAOYSA-N | ZX1 |
| NR2AS1-1 | YTSDVHCTYSWFSK-UHFFFAOYSA-N | hit series 1 |
| NR2AS1-2 | hit series 1 | |
| NR2AS1-3 | hit series 1 | |
| NR2AS1-4 | hit series 1 | |
| NR2AS1-5 | hit series 1 | |
| NR2AS1-6 | hit series 1 | |
| NR2AS2-1 | hit series 2 | |
| NR2AS2-2 | hit series 2 | |
| NR2AS2-3 | hit series 2 | |
| NR2AS2-4 | hit series 2 | |
| NR2AS2-5 | hit series 2 | |
| NR2AS2-6 | hit series 2 | |
| NR2AS2-7 | hit series 2 | |
| GNE-0723 | FTIBNGABJNFFAI-SVRRBLITSA-N | GNE NR2A PAM |
In the absence of ligands, ZX1 and GNE-0723 produced a minimal change in gene expression, thus indicating that these compounds selectively affect the NR2A signaling pathway in vitro (Figure 7C–E). However, members of hit series 1 and 2 had two distinct off-target signatures in the absence of ligands (Figure 7E). Unlike ZX1 and GNE-0723, which produced few transcriptional effects without ligands, NR2AS1-1 produced both an on- and off-target signature at the same dose (10 μM), in the presence and absence of ligands, respectively. Without ligands, NR2AS1-1, of hit series 1, clustered with both TPEN and TPA (Figure 7E), indicating that NR2AS1-1 induced off-target effects similar to known zinc chelators. NR2AS1-2 and -3 of the hit series 1 compound were able to produce an NMDA activation signature with ligands, but without ligands had subtle effects that did not overlap with TPEN and TPA (Figure 7D,E). Additionally, NR2AS2-1, -2, -4, and -5 of series 2, without ligands present, formed a distinct cluster and induced a significant number of DEGs (Figure 7E). This indicates that these compounds have a common but unknown, off-target that changes gene expression in human neurons. In a single assay, DRUG-seq discerned NR2A on-target effects and two distinct off-target effects, zinc chelation and an undefined activity produced by hits from series 2. This example highlights a key feature of DRUG-seq—the ability to look beyond the expected to identify additional biological activities early in the process of drug discovery. DRUG-seq helped gain a deeper picture of the total biological activity of compounds from both hit series and contextualized them relative to additional tool compounds. Overall, we envision that DRUG-seq can be incorporated into drug discovery projects at early stages to help prioritize potential therapeutic candidates.
Discussion
DRUG-seq is a target-agnostic high-throughput screening method with a transcriptome readout, and it can be broadly applied to new cellular models without redesign of the approach or a priori assumptions about key genes or pathways that will be measured. It is well suited for high-complexity RNA-seq studies in which many variables and perturbations are tested, such as the dose and length of treatment. DRUG-seq is a bulk RNA-seq readout, and, as such, is best applied to cell cultures with moderate to low heterogeneity. The bandwidth of DRUG-seq accommodates the profiling of a chemical series of related or unrelated chemotypes with different potencies and known or unknown on- and off-target activities. The total cost of DRUG-seq is $3–10 per condition including triplicates at a read depth of 0.25–1 million reads per well, respectively. This makes it possible to screen thousands of conditions while still providing a high-dimensional readout with greater than 7000 genes. The resulting high-dimensional data can be used to group compounds by MoA, conduct user-defined signature queries, or search for compounds that may reverse disease signatures. Although the work reported here describes the usage of compounds, one can leverage DRUG-seq profiling for other perturbagens, depending on the question and biological model.
The low cost allowed us to systematically test both the technical and biological variability across plates and batches of cells. By standardizing the experimental design, performance metrics can be tracked long term across many experiments. Using this information, we set statistically defined thresholds to determine the activity of treatments tested in a DRUG-seq experiment. The true null threshold allows us to pick treatments that are statistically defined as active and provides a minimal range of DE genes that we can trust to produce a reliable signature of expression. We also demonstrated that the results were highly reproducible across plates and batches of cells. The open-source analysis pipeline and available data will facilitate future analytical improvements and lower the barrier for new labs to adopt the platform.
By deploying transcriptomics at scale, we stand to gain biological insights beyond a single target or pathway. With the selection of a set of compounds with diverse MoAs, we demonstrated the granularity of DRUG-seq to discern specific MoAs, dose responses, and dose-dependent polypharmacology. This would be easy to miss if only a single or a few doses were tested. DRUG-seq is unbiased, as a selection of panels of genes is not required, and it quantifies 5–10x more transcripts than L1000 or other targeted amplicon approaches.5,6 The wide range of activity detected by DRUG-seq allows it to detect expected and unexpected biological responses. Being blind to the latter has likely contributed to the failure of many drugs at various stages of discovery and development. Furthermore, the dose-dependent detection of on- and off-target phenotypes and the switch between phenotypes can be used to determine potencies for each effect38 and potentially quantify selectivity and safety windows in the absence of dedicated assays.
Lastly, we show how DRUG-seq can impact a neuroscience drug development project. DRUG-seq was successfully used to compare NMDAR potentiators and zinc chelators. Not only did we detect on-target NMDAR activity signatures from two independent internal hit series, but we also uncovered that some representatives of each hit series had unique off-target effects. We were aware that series 1 had the potential to chelate zinc and confirmed this by detecting similarity to a signature induced by known chelators TPA and TPEN. In addition, we demonstrated that series 2 also had significant transcriptional effects not related to NMDAR and were likely caused by an undefined off-target effect. These results demonstrate that a high-dimensional unbiased transcriptomic readout has the potential to improve the efficiency of the drug development process to save both time and resources.
Materials and Methods
Cell Culture
U2-OS (ATCC HTB-96) was grown in DMEM, 10% FBS, and 1% Pen/Strep. The sufficient number of cells was grown prior to trypsin dissociation, the day of plating. Twenty microliters of cells were dispensed into 384-well black uClear polystyrene cell culture-treated plates (Griener, Cat#: 781090) using a bottle valve washer/dispenser from the Genomics Institute of the Novartis Research Foundation (GNF, http://www.gnfsystems.com) with a concentration of 5000 cells per well, a day prior to compound treatment. The GNF system is critical for large-scale experiments, but other standard plate wash/dispense equipment or multichannel pipettes will suffice for a smaller scale. Density optimization is required for each cell line for optimal downstream steps.
H9-hESCs were grown and expanded in mTESR media on hESC-qualified Matrigel. Ngn2 neurons were generated by exposing transgenic H9-hESCs, harboring a dox-inducible Ngn2 gene that was stably integrated on a piggyBac transposon, to doxycycline (1.9 μg/mL) for 3 days in DMEM/F-12 with Glutamax 95%, Pen/Strep 1% and N2 1%. Immature neurons at day 3 were dissociated using accutase, frozen in CryoStor CS5, and stored in liquid nitrogen. Thawed Ngn2 neurons were then replated in matrigel-coated 384-well plates at a density of 12 000 per well in 80 μL of media (DMEM/F-12 Glutamax 95%, B27 2%, Pen/Strep 1%, N2 1%, NT3 9.5 ng/mL, 3.8 ng/mL BDNF) with doxycycline (1.9 μg/mL). The Ngn2 neurons were hemifed every other day until day 14 of differentiation, at which point the neurons were treated with compounds for 6 h prior to lysis for DRUG-seq.
Day 1–2: Compound Treatment and Lysis
| 2× lysis buffer stock—store at room temp | |
| component | volume |
| 1 M Tris-HCl pH8.0 (Life Tech,15568-025) | 1000 μL |
| 2 M KCl (Ambion, AM9640G) | 750 μL |
| 20% of 20% Ficoll PM-400 in H2O | 6000 μL |
| (Sigma, F5415-25ML) | |
| Triton-100 (Sigma, T8787-100ML) | 30 μL |
| H2O | 2220 μL |
| 2× lysis buffer—make fresh each day | |
| component | volume |
| 2× lysis buffer stock | 4800 μL |
| RiboLock RNase inhibitor 40 U/μL | 120 μL |
| (ThermoFisher, EO0381) |
One day after plating, 20 nL of each compound was added using an acoustic dispense Echo 555 Liquid Handler (Labcyte). After a 6 h (Ngn2) or 24 h (U2-OS) of compound treatment, the media was aspirated down to 7.5 μL and an equal amount of 2× lysis buffer was added to all wells using the bottle valve washer/dispenser from GNF (U2-OS plates were sealed and placed on a microplate shaker HT-91002 (BigBear automation) for 4 min at 900 rpm). Lysis duration is cell type and density-dependent and requires optimization. Ngn2 neurons plates were lysed for 8 min. Plates were then centrifuged at 2000 rpm for 1 min before storage at −80 C until ready for further sample processing. Plates can be stored in −80 C for up to 3–4 weeks, after which RNA quality may begin to deteriorate.
Day 3: Reverse Transcription and Library Construction
| RT mix | |
| component | per well |
| 5XRT buffer (ThermoFisher, EP0742) | 0.5 μL |
| 1 M MgCl2 (Ambion, AM9530G) | 0.1 μL |
| regular template switching primer 100 μM | 0.1 μL |
| (Integrated DNA Technologies) | |
| RiboLock RNase inhibitor 40 U/μL | 0.1 μL |
| (ThermoFisher, EO0381) | |
| dNTP 2.5 μM (ThermoFisher, AM8228G) | 0.1 μL |
| maxima RT (ThermoFisher, EP0742) | 0.1 μL |
| H2O (ThermoFisher, AM8228G) | 1.5 μL |
On the day of sample processing, the assay plates were placed on ice until thawed. In an Armadillo PCR plate (ThermoFisher, AB2384), 2.75 μL of RT mix was added using a Multidrop Combi (ThermoFisher, 5840300). Once the assay plates were thawed, they were centrifuged at 2000 rpm for 1 min and then 15 μL of cell lysate was transferred using a Bravo (Agilent Technologies) into the plate containing RT mix. The assay plates are then centrifuged again at 2000 rpm for 1 min and 10 nL of 1 μM barcoded DRUG-seq RT primers were then dispensed into each well using an Echo 555 Liquid Handler (Labcyte). Plates were sealed (Bio-Rad, MSB1001), centrifuged for 1 min at 2000 rpm, and incubated at 42 C on a ProFlex PCR system (ThermoFisher, 4484077) for 2 h.
After RT, samples were centrifuged for 1 min at 2000 rpm. Next, each individual plate was pooled into a reagent reservoir (ThermoFisher, 1064-05-7) using a Bravo Automated Liquid Handling Platform (Agilent). Samples were then transferred from the reservoir into a 50 mL conical tube, purified and concentrated using the DNA clean and concentrator-100 kit (Zymo Research, Cat#: D4030), and eluted in 150 μL of water. Due to the high volume after the addition of DNA binding buffer, samples were run three times through the same DNA clean and concentrator filter before elution. We further purified the materials eluted from the columns by adding 150 μL (1:1) of AMPure beads RNA clean XP (Beckman coulter, A63987) and incubating for 5 min. The bound beads were pelleted with a magnet and washed twice for 30 s with enough freshly made 80% ethanol to submerge the beads. After removal of ethanol, the beads were allowed to dry completely before eluting with 32 μL of water. To remove single-stranded DNA and excess nucleotides, exonuclease I (Exol) treatment was performed on all samples by adding 4 μL of ExoI buffer and 4 μL of ExoI (New England Biolabs, M0293L). Samples were incubated at 37 C for 30 min, heat inactivated at 85 C for 15 min, and held at 4 C. cDNA was then amplified by adding 50 μL 2X Kapa HIFI PCR ReadyMix (Kapa Biosystems, KK2602), 10 μL of the 10 μM DRUG-seq PCR primer (File S5), and then running the following program:
| temperature | time | cycles |
| 96 C | preheat and pause | |
| 96 C | 1 min | 1 |
| 98 C | 20 s | 5 |
| 58 C | 4 min | |
| 72 C | 6 min | |
| 98 C | 20 s | 13 |
| 60 C | 30 s | |
| 72 C | 6 min | |
| 72 C | 10 min | 1 |
| 4 C | hold (overnight) |
cDNA samples were purified using the Agencourt RNA
clean beads
as described above but eluted with 11 μL of water. We ran 1
μL on a Bioanalyzer (Agilent, G2939BA) with a DNA high-sensitivity
chip (Agilent) or a Fragment Analyzer (Agilent, M5310AA). We expect
to see a wide range of fragment sizes, as represented in the figure
below. Preamp abundance will be determined by cell type, but for U2-OS
cells, we generally observe quantities of 1–5 ng/μL.
Sizes range from 200 to 6000 (representative below).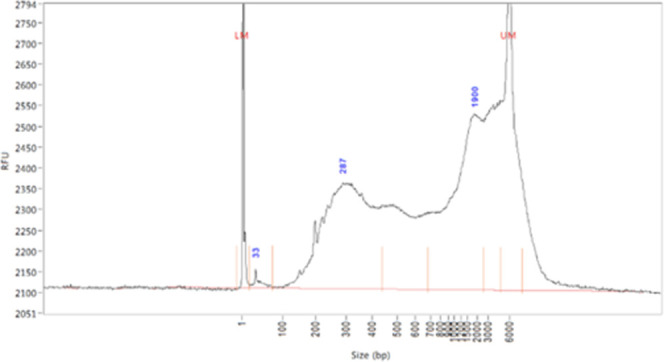
Day 4: Tagmentation, Purification, and Quantification of DRUG-seq Libraries
For tagmentation, 5 μL of preamp material, measured by the fragment analyzer, was mixed with nuclease-free water to a final volume of 20 μL. The 20 μL of preamp was then mixed with 25 μL of TD buffer and 5 μL of TDE1 buffer (Nextera kit, FC-131-1096, Illumina) and incubated for 5 min at 55 C and held at 10 C. Tagmented DNA was purified with the Qiagen MinElute PCR Purification Kit (Qiagen, Cat#: 28004) and eluted with 25 μL of nuclease-free water.
Each 25 μL sample is then PCR amplified using 15 μL of NPM (Nextera XT DNA library preparation kit, FC-131-1024/FC-131-1096), 5 μL of DRUG-seq_p5_PCR primer (5 μM), and 5 μL DRUG-seq indexing primer (Table S4). The PCR cycles were as follows:
| temperature | time | cycles |
| 72 C | preheat and pause | |
| 72 C | 3 min | 1 |
| 95 C | 30 s | 1 |
| 95 C | 10 s | 15 |
| 55 C | 30 s | |
| 72 C | 30 s | |
| 72 C | 5 min | 1 |
| 4 C | hold |
The amplicons
were then purified using the Agencourt RNA clean
beads as described above but this time eluted with 20 μL of
nuclease-free water. The samples were then size-selected for 200–600
bp fragments using a PippinHT 2% agarose precast gel cassette (Sage
Science, HTC2010). One microliter of the samples from the PippinHT
was analyzed on a Fragment Analyzer (Agilent) using a DNF-474 High-Sensitivity
NGS Fragment Kit 1-6000bp (Agilent, DNF-474-0500). We generally observe
approximately 5–10 ng/μL, averaging a size of 300 bp.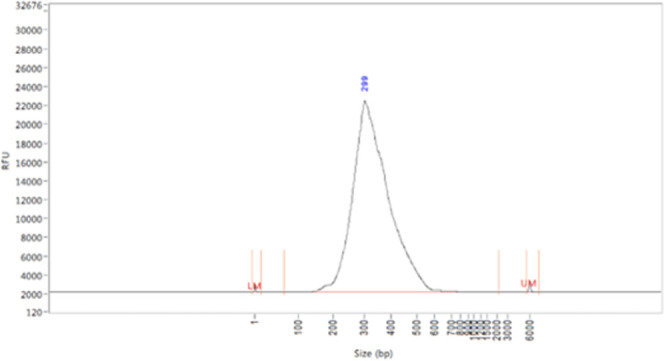
To quantify the libraries, qPCR was performed using Kapa library quantification kit for Illumina (KAPA #KK4824 Roche #07960140001). Following the Kapa kit manual, a premix of 5 mL Kapa SYBR FAST qPCR Master Mix, 1 mL Illumina primer premix, and 200 μL ROX low was combined, and the libraries were diluted 1:20 000 with nuclease-free water. The diluted libraries as well as the six standards provided in each kit were plated in triplicate using 4 μL per well. The reagent premix was plated using 6 μL per well. The plate was sealed and run on a QuantStudio 12k Flex with the following cycling:
| temperature | time | cycles |
| 95 C | 1 min | 1 |
| 95 C | 15 s | 35 |
| 63 C | 45 s | |
| 95 C | 15 s | melt curve stage |
| 60 C | 1 min hold | |
| 95 C | 15 s |
qPCR data analysis was performed using automatic threshold and baseline settings in QuantStudio software. The quantities calculated by the software were then dilution corrected by multiplying by the dilution factor above and size corrected following the Kapa kit manual. The libraries were normalized and pooled based on the qPCR quantities. On the following day, library denature was made and sequencing was performed on Illumina’s HiSeq. 4000 utilizing a custom Read 1 primer (following manufacturer’s protocol).
Primer sequences (seeFile S5)
Template switching primer
AAGCAGTGGTATCAACGCAGAGTGAATrGrGrG
DRUG-seq Barcoded RT primers: AAGCAGTGGTATCAACGCAGAGTACAACAAGGTACNNNNNNNNNNTTTTTTTTTTTTTTTTTTTTTTTTV
DRUG-seq PCR primer
AAGCAGTGGTATCAACGCAGAGT
DRUG-seq_p5_PCR primer
AATGATACGGCGACCACCGAGATCTACACGCCTGTCCGCGGAAGCAGTGGTATCAACGCAGAGT*A*C
DRUG-seq indexing
CAAGCAGAAGACGGCATACGAGATNNNNNNNNGTCTCGTGGGCTCGG
DRUG-seq custom read 1 primer
GCCTGTCCGCGGAAGCAGTGGTATCAACGCAGAGTAC
Code and Data
The data analysis pipeline starts at UMI counts the matrix, which is shown in Figure 3A. We first used true null calculation to find the bad and best DMSOs and then filtered out the bad DMSO for the following differential expression gene analysis. Before conducting differential expression gene analysis, we applied 75% percentile gene-level filter across all compounds treated wells and then calculated the fold change using limma-trend package. The differential expressed genes are defined as effect size is greater than 2-fold and adjusted p-value after the multiple comparisons is less than 0.1. In addition, we also generated the UMAP plot to show the global transcriptomic information of the most active compounds. We applied second true null to selected best DMSOs for investigating the technical noise. We chose 95% percentile as the number of DEGs threshold for active compounds selection and used all differentially expressed genes in the differential gene expression analysis. The batch effect was removed and applied to the plate level before generating the UMAP plot. The NR2A study was designed differently from the 14 compounds. This study had a small number of compounds to treat in the absence or presence of ligands. All replicates are on a single plate for the NR2A experiment. In addition, the DESeq2 R package was applied to calculate the DEGs.
Raw data and processed data: GSE176150
Acknowledgments
The authors would like to thank D. Palacios and M. Healy for reviewing the compound lists; E. Lounkine for help selecting Zinc chelating compounds; B. Peterson for input on designing the NR2A PAM experiment; R. Dolmetsch for support of the DRUG-seq platform; A. Abrams for rendering Figure 1B; and Jack Hsiao for IF image of neurons.
Supporting Information Available
The Supporting Information is available free of charge at https://pubs.acs.org/doi/10.1021/acschembio.1c00920.
Files S1–S4 include the metadata for the 14-compound experiment, the random DMSO wells selected for steps 1 and 2 of the true null calculation, and an interactive UMAP of representing the gene expression data of each compound treatment; File S5 indicates the primers used in the study; Files S6 and S7 include the metadata and results for the NR2A experiment; and the raw data is available for GSE176150 and the code at https://github.com/Novartis/DRUG-seq (ZIP)
Author Present Address
§ Tevard Biosciences, Cambridge, MA (G.S.)
Author Contributions
∥ J.L. and D.J.H. contributed equally to this work. D.J.H., C.Y., and M.H., developed the protocol and generated the 14-compound data set. A.L. performed sequencing. L.M. tested the protocol as a first-time user. C.R. and M.H. designed the 14-compound experiment. C.R., M.H., C.G.K., K.A.W., and J.L.J. provided experimental feedback. J.L., F.D.S., R.G., M.N., S.R., and D.J.H. developed computational methods to analyze DRUG-seq data. T.T. tested the code as a first-time user. X.K. and B.K. assayed and cultured neurons for NR2A experiments. G.S-L. and G.S. developed NR2A potentiators. R.J.I., D.J.H., J.L., and K.A.W. wrote the manuscript.
The authors declare the following competing financial interest(s): All authors were employees of Novartis Institutes for BioMedical Research at the time of this research.
Supplementary Material
References
- Swinney D. C.; Anthony J. How were new medicines discovered?. Nat. Rev. Drug Discovery 2011, 10, 507–519. 10.1038/nrd3480. [DOI] [PubMed] [Google Scholar]
- Volochnyuk D. M.; Ryabukhin S. V.; Moroz Y. S.; Savych O.; Chuprina A.; Horvath D.; Zabolotna Y.; Varnek A.; Judd D. B. Evolution of commercially available compounds for HTS. Drug Discovery Today 2019, 24, 390–402. 10.1016/j.drudis.2018.10.016. [DOI] [PubMed] [Google Scholar]
- Cleary B.; Cong L.; Cheung A.; Lander E. S.; Regev A. Efficient Generation of Transcriptomic Profiles by Theory Efficient Generation of Transcriptomic Profiles by Random Composite Measurements. Cell 2017, 171, 1424–1436. 10.1016/j.cell.2017.10.023. [DOI] [PMC free article] [PubMed] [Google Scholar]
- Verbist B.; Horchreiter S.; et al. Using transcriptomics to guide lead optimization in drug discovery projects: Lessons learned from the QSTAR project. Drug Discovery Today 2015, 20, 505–513. 10.1016/j.drudis.2014.12.014. [DOI] [PubMed] [Google Scholar]
- Subramanian A.; Narayan R.; Corsello S. M.; Peck D. D.; Natoli T. E.; Lu X.; Gould J.; Davis J. F.; Tubelli A. A.; Asiedu J. K.; Lahr D. L.; et al. A Next Generation Connectivity Map: L1000 Platform and the First 1,000,000 Profiles. Cell 2017, 171, 1437–1452. 10.1016/j.cell.2017.10.049. [DOI] [PMC free article] [PubMed] [Google Scholar]
- Li H.; Qiu J.; Fu X. D. RASL-seq for Massively Parallel and Quantitative Analysis of Gene Expression. Curr. Protoc. Mol. Biol. 2012, 98, 1–9. 10.1002/0471142727.mb0413s98. [DOI] [PMC free article] [PubMed] [Google Scholar]
- Kong L.; Chen Y.; Xu F.; Xu M.; Li Z.; Fang J.; Zhang L.; Pian C. Mining influential genes based on deep learning. BMC Bioinf. 2021, 22, 27 10.1186/s12859-021-03972-5. [DOI] [PMC free article] [PubMed] [Google Scholar]
- Srivatsan S. R.; McFaline-Figueroa J. L.; Ramani V.; Saunders L.; Cao J.; Packer J.; Pliner H. A.; Jackson D. L.; Daza R. M.; Christiansen; et al. Massively multiplex chemical transcriptomics at single-cell resolution. Science 2020, 367, 45–51. 10.1126/science.aax6234. [DOI] [PMC free article] [PubMed] [Google Scholar]
- Lancaster Ma.; Knoblich Ja. Organogenesis in a dish: modeling development and disease using organoid technologies. Science 2014, 345, 1247125 10.1126/science.1247125. [DOI] [PubMed] [Google Scholar]
- Ye C.; Ho D. J.; Neri M.; Yang C.; Kulkarni T.; Randhawa R.; Henault M.; Mostacci N.; Farmer P.; Renner S.; et al. DRUG-seq for miniaturized high-throughput transcriptome profiling in drug discovery. Nat. Commun. 2018, 9, 4307 10.1038/s41467-018-06500-x. [DOI] [PMC free article] [PubMed] [Google Scholar]
- Yeakley J. M.; Shepard P. J.; Goyena D. E.; Vansteenhouse H. C.; McComb J. D.; Seligmann B. E. A Trichostatin a expression signature identified by TempO-Seq targeted whole transcriptome profiling. PLoS One 2017, 12, e0178302 10.1371/journal.pone.0178302. [DOI] [PMC free article] [PubMed] [Google Scholar]
- Bush E. C.; Ray F.; Alvarez M. J.; Realubit R.; Li H.; Karan C.; Califano A.; Sims P. A. PLATE-Seq for genome-wide regulatory network analysis of high-throughput screens. Nat. Commun. 2017, 8, 105 10.1038/s41467-017-00136-z. [DOI] [PMC free article] [PubMed] [Google Scholar]
- Sholder G.; Lanz T. A.; Moccia R.; Quan J.; Aparicio-Prat E.; Stanton R.; Xi H. S. 3′Pool-seq: An optimized cost-efficient and scalable method of whole-transcriptome gene expression profiling. BMC Genomics 2020, 21, 64 10.1186/s12864-020-6478-3. [DOI] [PMC free article] [PubMed] [Google Scholar]
- König R.; Chiang C.; Tu B. P.; Yan S. F.; DeJesus P. D.; Romero A.; Bergauer T.; Orth A.; Krueger U.; Zhou Y.; Chanda S. K. A probability-based approach for the analysis of large-scale RNAi screens. Nat. Methods 2007, 4, 847–849. 10.1038/nmeth1089. [DOI] [PubMed] [Google Scholar]
- Ritchie M. E.; Phipson B.; Wu D.; Hu Y.; Law C. W.; Shi W.; Smyth G. K. limma powers differential expression analyses for RNA-sequencing and microarray studies. Nucleic Acids Res. 2015, 43, e47 10.1093/nar/gkv007. [DOI] [PMC free article] [PubMed] [Google Scholar]
- Becht E.; Mcinnes L.; Healy J.; Dutertre C.; Kwok I. W. H.; Ng L. G.; Ginhoux F.; Newell E. W. Dimensionality reduction for visualizing single-cell data using UMAP. Nat. Biotechnol. 2019, 37, 38–44. 10.1038/nbt.4314. [DOI] [PubMed] [Google Scholar]
- Blondel V. D.; Guillaume J.-L.; Lambiotte R.; Lefebvre E. Fast unfolding of communities in large networks. J. Stat. Mech.: Theory Exp. 2008, 2008, P10008 10.1088/1742-5468/2008/10/P10008. [DOI] [Google Scholar]
- Hay N.; Sonenberg N. Upstream and downstream of mTOR. Genes Dev. 2004, 18, 1926–1945. 10.1101/gad.1212704. [DOI] [PubMed] [Google Scholar]
- Millier A.; Schmidt U.; Angermeyer M. C.; Chauhan D.; Murthy V.; Toumi M.; Cadi-Soussi N. Humanistic burden in schizophrenia: A literature review. J. Psychiatr. Res. 2014, 54, 85–93. 10.1016/j.jpsychires.2014.03.021. [DOI] [PubMed] [Google Scholar]
- Snyder M. A.; Gao W. J. NMDA receptor hypofunction for schizophrenia revisited: Perspectives from epigenetic mechanisms. Schizophr. Res. 2020, 217, 60–70. 10.1016/j.schres.2019.03.010. [DOI] [PMC free article] [PubMed] [Google Scholar]
- Nakazawa K.; Sapkota K. The origin of NMDA receptor hypofunction in schizophrenia. Pharmacol. Ther. 2020, 205, 107426 10.1016/j.pharmthera.2019.107426. [DOI] [PMC free article] [PubMed] [Google Scholar]
- Ripke S.; Walters J. T. R.; O’Donovan M.C.. The Schizophrenia Working Group of the Psychiatric Genomics Consortium Mapping genomic loci prioritises genes and implicates synaptic biology in schizophrenia 2020, 10.1101/2020.09.12.20192922. [DOI]
- Niu H.-M.; Yang P.; Chen H.-H.; Hao R.-H.; Dong S.-S.; Yao S.; Chen X.-F.; Yan H.; Zhang Y.-J.; Chen Y.-X.; et al. Comprehensive functional annotation of susceptibility SNPs prioritized 10 genes for schizophrenia. Transl. Psychiatry 2019, 9, 56 10.1038/s41398-019-0398-5. [DOI] [PMC free article] [PubMed] [Google Scholar]
- XiangWei W.; Jiang Y.; Yuan H. De novo mutations and rare variants occurring in NMDA receptors. Curr. Opin. Physiol. 2018, 2, 27–35. 10.1016/j.cophys.2017.12.013. [DOI] [PMC free article] [PubMed] [Google Scholar]
- Working S.; Consortium G.. Biological insights from 108 schizophrenia-associated genetic loci 2014. [DOI] [PMC free article] [PubMed]
- Paoletti P.; Bellone C.; Zhou Q. NMDA receptor subunit diversity: Impact on receptor properties, synaptic plasticity and disease. Nat. Rev. Neurosci. 2013, 14, 383–400. 10.1038/nrn3504. [DOI] [PubMed] [Google Scholar]
- Hansen K. B.; Yi F.; Perszyk R. E.; Furukawa H.; Wollmuth L. P.; Gibb A. J.; Traynelis S. F. Structure, function, and allosteric modulation of NMDA receptors. J. Gen. Physiol. 2018, 150, 1081–1105. 10.1085/jgp.201812032. [DOI] [PMC free article] [PubMed] [Google Scholar]
- Amico-Ruvio S. A.; Murthy S. E.; Smith T. P.; Popescu G. K. Zinc effects on NMDA receptor gating kinetics. Biophys. J. 2011, 100, 1910–1918. 10.1016/j.bpj.2011.02.042. [DOI] [PMC free article] [PubMed] [Google Scholar]
- Chen N.; Moshaver A.; Raymond L. A. Differential sensitivity of recombinant N-methyl-D-aspartate receptor subtypes to zinc inhibition. Mol. Pharmacol. 1997, 51, 1015–1023. 10.1124/mol.51.6.1015. [DOI] [PubMed] [Google Scholar]
- Maret W. Zinc in cellular regulation: The nature and significance of “zinc signals. Int. J. Mol. Sci. 2017, 18, 2285 10.3390/ijms18112285. [DOI] [PMC free article] [PubMed] [Google Scholar]
- Blakemore L. J.; Trombley P. Q. Zinc as a neuromodulator in the central nervous system with a focus on the olfactory bulb. Front. Cell. Neurosci. 2017, 11, 297 10.3389/fncel.2017.00297. [DOI] [PMC free article] [PubMed] [Google Scholar]
- Maares M.; Haase H. Zinc and immunity: An essential interrelation. Arch. Biochem. Biophys. 2016, 611, 58–65. 10.1016/j.abb.2016.03.022. [DOI] [PubMed] [Google Scholar]
- Huang Z.; Lippard S. J.; et al. Tris(2-pyridylmethyl)amine (TPA) as a membrane-permeable chelator for interception of biological mobile zinc†. Metallomics 2013, 5, 648–655. 10.1039/c3mt00103b. [DOI] [PMC free article] [PubMed] [Google Scholar]
- Pan E.; Zhang X.-a.; Huang Z.; Krezel A.; Zhao M.; Tinberg C. E.; Lippard S. J.; McNamara J. O. Vesicular Zinc Promotes Presynaptic and Inhibits Postsynaptic Long-Term Potentiation of Mossy Fiber-CA3 Synapse. Neuron 2011, 71, 1116–1126. 10.1016/j.neuron.2011.07.019. [DOI] [PMC free article] [PubMed] [Google Scholar]
- Huang Z.; Zhang X. A.; Bosch M.; Smith S. J.; Lippard S. J. Tris(2-pyridylmethyl)amine (TPA) as a membrane-permeable chelator for interception of biological mobile zinc. Metallomics 2013, 5, 648–655. 10.1039/c3mt00103b. [DOI] [PMC free article] [PubMed] [Google Scholar]
- Volgraf M.; Sellers B. D.; Jiang Y.; Wu G.; Ly C. Q.; Villemure E.; Pastor R. M.; Yuen P.; Lu A.; Luo X.. et al. Discovery of GluN2A-Selective NMDA Receptor Positive Allosteric Modulators (PAMs): Tuning Deactivation Kinetics via Structure-Based Design 2016, 59, 10.1021/acs.jmedchem.5b02010. [DOI] [PubMed]
- Zhang Y.; Pak C.; Han Y.; Ahlenius H.; Zhang Z.; Chanda S.; Marro S.; Patzke C.; Acuna C.; Covy J.; et al. Rapid single-step induction of functional neurons from human pluripotent stem cells. Neuron 2013, 78, 785–798. 10.1016/j.neuron.2013.05.029. [DOI] [PMC free article] [PubMed] [Google Scholar]
- Renner S.; Bergsdorf C.; Bouhelal R.; Koziczak-Holbro M.; Amati A. M.; Techer-Etienne V.; Flotte L.; Reymann N.; Kapur K.; Hoersch; et al. Gene-signature-derived IC50s/EC50s reflect the potency of causative upstream targets and downstream phenotypes. Sci. Rep. 2020, 10, 9670 10.1038/s41598-020-66533-5. [DOI] [PMC free article] [PubMed] [Google Scholar]
Associated Data
This section collects any data citations, data availability statements, or supplementary materials included in this article.


