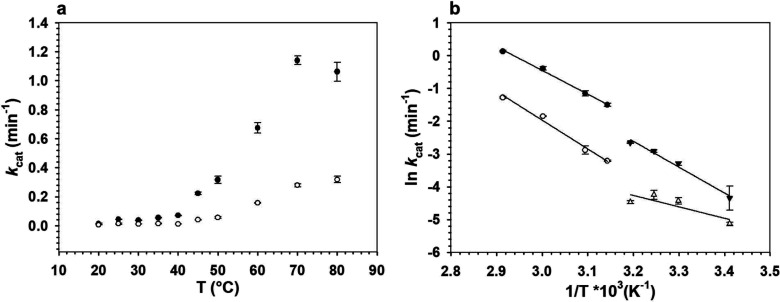
Figure 3.
Temperature dependence of kcat ((a), temperature profile; (b) Arrhenius plots) for the reaction of TaCPa2E with CDP-Glc and CDP-[2-2H]Glc. Epimerizations were analyzed in a temperature range of 20–80 °C using TaCPa2E (1.0 mg/mL; 25.4 μM) and 4.00 mM CDP-Glc (black dots, black triangles) or CDP-[2-2H]Glc (white circles, white triangles). Due to a low coefficient of determination, results for 25 and 80 °C were omitted in (b). Symbols show the experimental data, and error bars show the associated S.D. (N = 4). The lines in panel (b) are straight-line fits with the Arrhenius model (eq 1).

