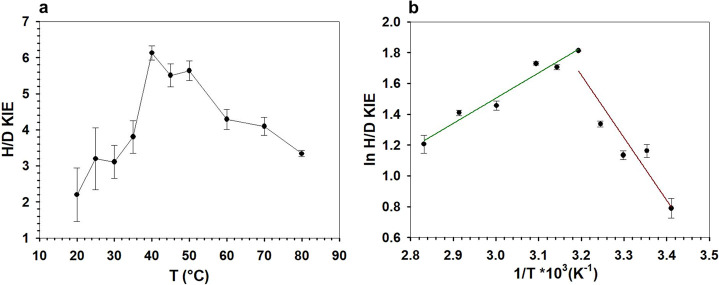
Figure 4.
Temperature dependence of the KIE on kcat for TaCPa2E. (a) H/D KIE dependent on temperature T (°C) and (b) ln H/D KIE dependent on reciprocal T (1/K). In panel (b), two temperature regimes are highlighted (green: 40–80 °C; brown: 20–40 °C). The straight lines are linear fits of the data. Symbols show the experimental data, and error bars show the associated S.D. (N = 4).

