
FIGURE 4.
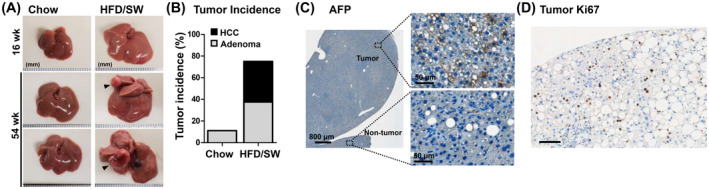
Mice fed HFD/SW for 54 weeks develop HCC. (A) Representative liver images of mice fed chow diet or HFD/SW for 16 and 54 weeks. Black arrows indicate liver tumors. (B) Liver tumor incidence for mice fed chow diet (n = 9) and HFD/SW for 54 weeks (n = 16) represented as the percentage of mice with HCCs and adenomas. (C) Representative immunohistochemical staining for tumor marker AFP in tumor and non‐tumor tissue. Scale bars: 800 and 50 µm (image insets). (D) Intratumor hepatocyte proliferation was shown as Ki67 staining. Scale bar: 100 µm. AFP, α‐fetoprotein; HCC, hepatocellular carcinoma; SW, sugar water.