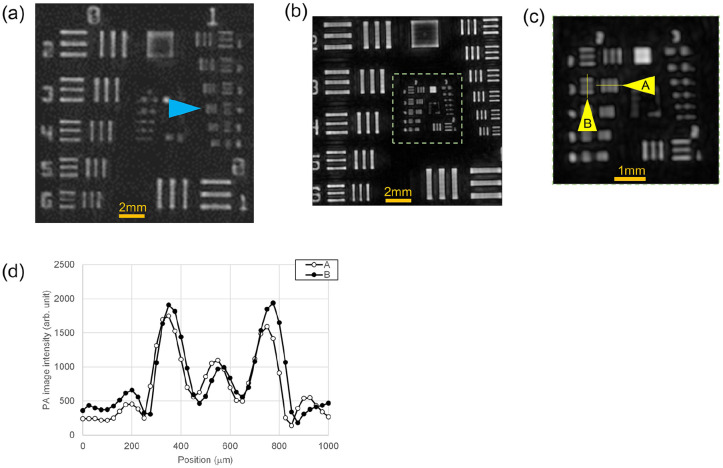
Figure 1.
The performance of LUB-0 system evaluated using the USAF1951 chart phantom. (a) PA image taken by an HDA with conventional performance, which is a comparative example. (b) PA image obtained by the newly designed HDA. (c) The magnified view of the dashed square in (b). (d) A graph of the image intensity profile on the lines indicated by A and B in (c).

