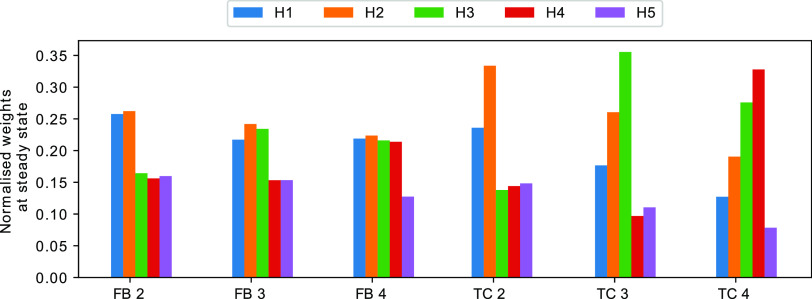
Figure 4.
Normalized weights for a variety of TC and FB tasks. First (blue) bar refers to the first weight, second (orange) to the weight for the second channel, and so on. Each value represents the average over 300 time units of a single simulation. Data was only collected after the weights reached the steady state (after 700 time units). In all experiments, we set the number of E1 molecules at the start of the simulation to 40. Nonlinearity was set to m = 5 for the TC and m = 1 for FB.

