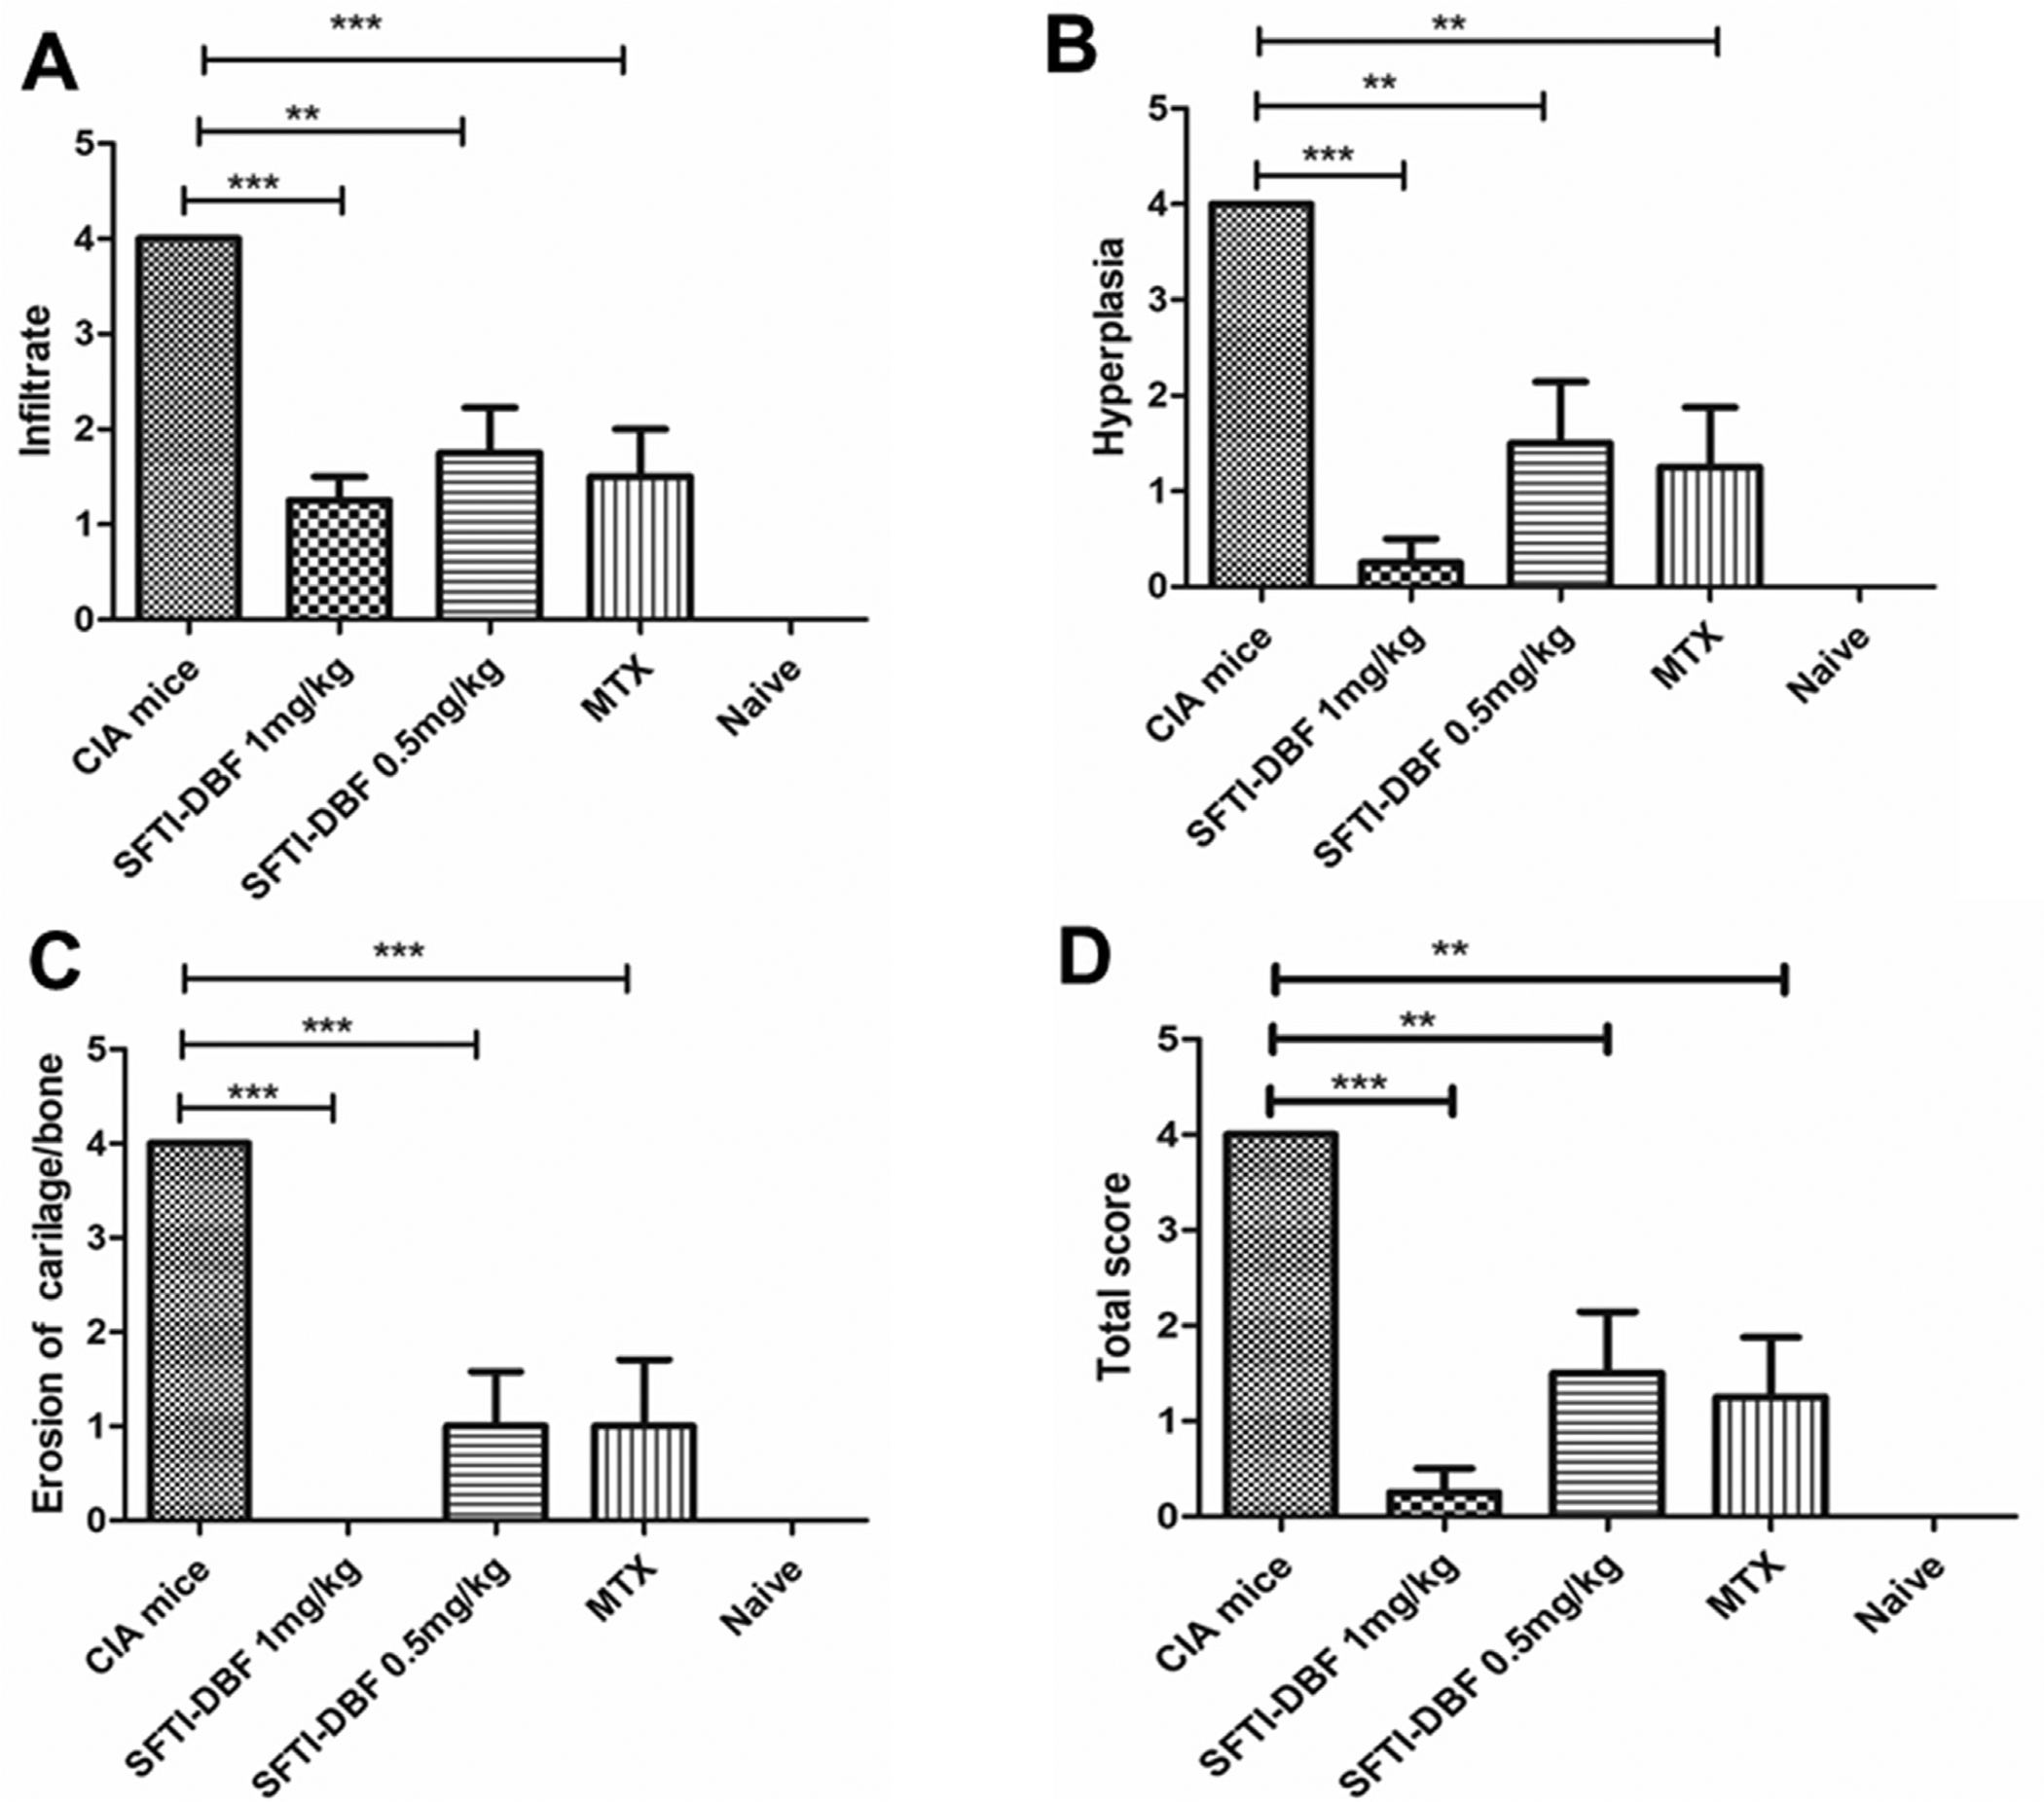
Fig. 6.

A-D). Evaluation of inflammation, synovial hyperplasia, and erosion of bone and cartilage in joint sections in CIA mice (Numbers of limb tissues analyzed (N) = 4). A score of 0–4 was assigned depending on the severity of the histological findings. Each joint was given a total score by observing the above changes with score 0; normal joint, score 1; mild inflammation and synovial hyperplasia without damage to cartilage/bone and score 2–4; severe inflammation and synovial lining hyperplasia with pannus formation and cartilage. Scores are compared within different groups, and values represent the mean ± SEM. Statistical analysis indicated that p < 0.01 (**), p < 0.001 (***) for different treatment groups compared to control (CIA) mice.
