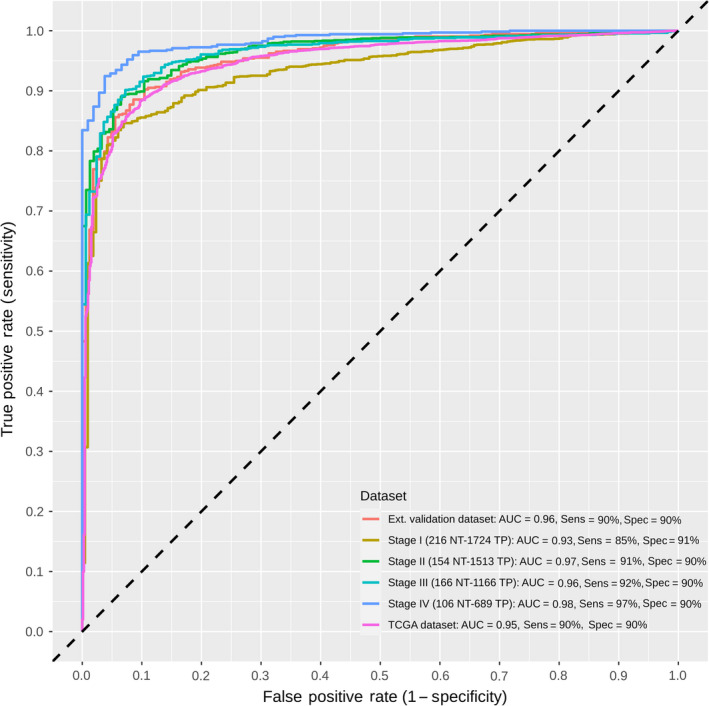
Fig. 4.

Receiver operating characteristic (ROC) curves of the final pan‐cancer model, validation datasets, and stage stratification. The final model included four CpG probes and accounted for age and tumor stage. Sensitivity and specificity at various cutoff values for the datasets and stages are plotted. The final model yielded an area under the curve (AUC) of 0.95 and a sensitivity and specificity of 90% with similar metrics when validated. Predictions in stage I were the poorest, with an AUC of 0.93 a sensitivity of 85% and a specificity of 91%. Performance in the subsequent stages improved, reaching an AUC of 0.98 and a sensitivity and specificity of 97% and 90%, respectively, in stage IV. The dotted diagonal line represents the line of no discrimination between tumor and normal tissues. AUC, area under the curve; NT, normal tissue; TP, primary tumor.
