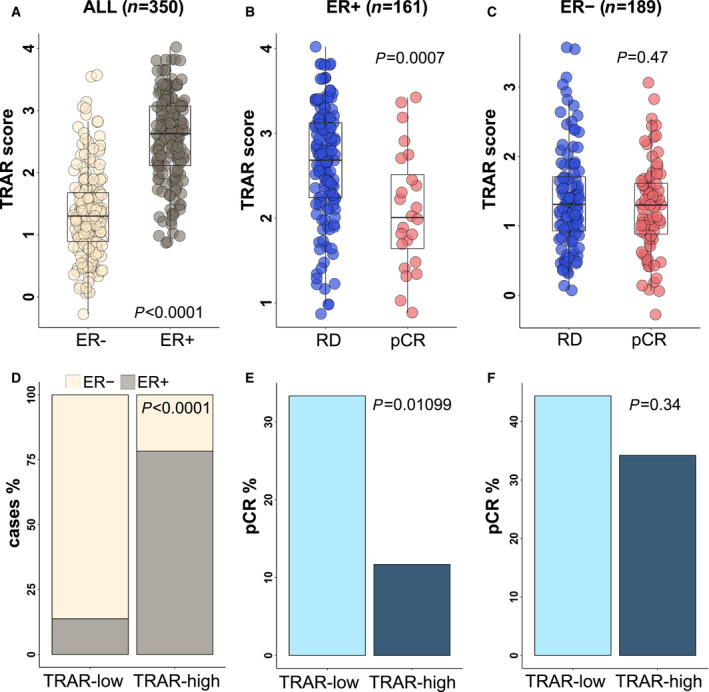
Fig. 3.

Predictive performance of TRAR according to tumor ER expression. (A) Box‐plots of the distribution of TRAR score in pre‐treatment patients (n = 350) with estrogen receptor‐positive (ER+) and estrogen receptor‐negative (ER−) tumors. P‐value by Wilcoxon test. (B‐C) Box‐plots of the distribution of TRAR score in patients with residual disease (RD) and pathological complete response (pCR) in the ER+ (n = 161, B) and ER− (n = 189, C) cohorts. P‐values by Wilcoxon test. (D) Frequency of ER status in TRAR‐low and TRAR‐high groups (n = 350). P‐value by chi‐square test. (E‐F) Frequency of pCR in patients with TRAR‐low and TRAR‐high and ER+ (n = 161, E) and ER− (n = 189, F) tumors. P‐values by chi‐square test.
