
Fig. 1.
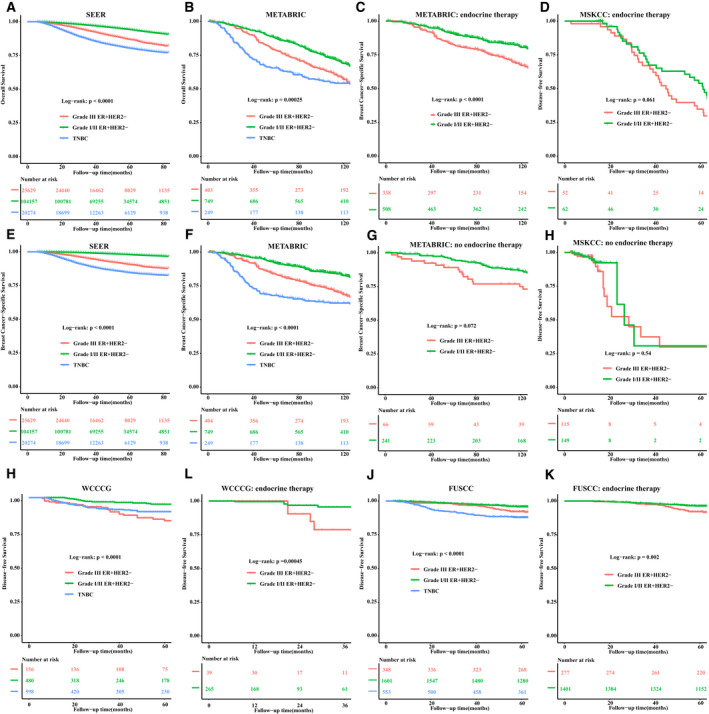
Survival analysis between histologic grade I/II ER+HER2−, III ER+ HER2−, and TNBC breast cancer. Kaplan–Meier curves of OS from the SEER (A) and the METABRIC cohort (B); BCSS within grade III ER+HER2− patients who received endocrine therapy group from the METABRIC (C) and MSKCC cohort (D); BCSS from the SEER (E) and METABRIC cohort (F); BCSS within grade III ER+HER2− patients who did not receive endocrine therapy group from the METABRIC (G) and MSKCC cohort (H); DFS from WCCCG (I) and FUSCC (K); DFS within grade III ER+HER2− cases who received more than 1‐year endocrine therapy from WCCCG (J) and FUSCC (L).