
Fig. 4.
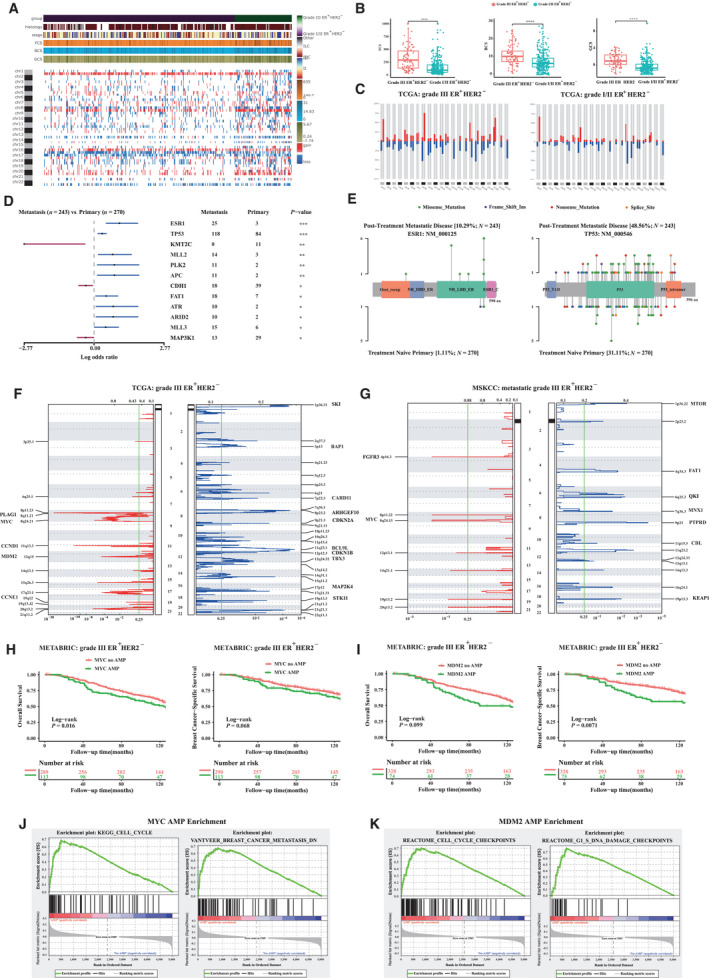
Elucidating therapeutic molecular targets for histologic grade III ER+HER2− breast cancer patients. (A) Genome‐wide profiling by chromosome arms distributed according to the histologic grade. (B) FCS, BCS, and GCS distribution by the histologic grade. (C) CNApp frequencies for chromosome arm regions using default cutoffs, corresponding to 2.3/1.7 copies for gains and losses, respectively. (D) Forest plot showing the tumor evolution under endocrine therapy (Pearson’s chi‐square or Fisher exact test; ***P < 0.001, **P < 0.01, and *P < 0.05), where somatic mutations within treatment‐naïve primary disease were compared with that of metastatic disease from MSKCC cohort. (E) Two top differential mutated genes (ESR1 and TP53) between treatment‐naïve primary disease and metastatic disease discovered in MSKCC cohort. Mutations were labeled in a diagram of the gene coding region, and the heights of the ‘‘lollipop’’ sticks indicate the number of the indicated mutation. (F) GISTIC plots. Regions of gain and loss delineated by GISTIC analysis of grade III ER+HER2− breast cancer samples from TCGA cohort. Significance is reported as false discovery rate‐corrected q‐value. Known tumor suppressor genes and proto‐oncogenes defined as found in COSMIC; if there is more than one known proto‐oncogene in the region, only one is listed (priority for listing is, in order: known breast mutation; other known mutation (by COSMIC frequency). (G) GISTIC plots. Regions of gain and loss delineated by GISTIC analysis of metastatic grade III ER+HER2− breast cancer cases from MSKCC cohort. (H) Kaplan–Meier curves of OS and BCSS between grade III ER+HER2− breast cancer patients with MYC amplification and non‐MYC amplification. (I) Kaplan–Meier curves of OS and BCSS between grade III ER+HER2− breast cancer patients with MDM2 amplification and non‐MDM2 amplification. (J) Enriched pathways related to MYC amplification and (K) related to MDM2 amplification within grade III ER+HER2− breast cancer from the TCGA cohort by gene set enrichment analysis (GSEA).