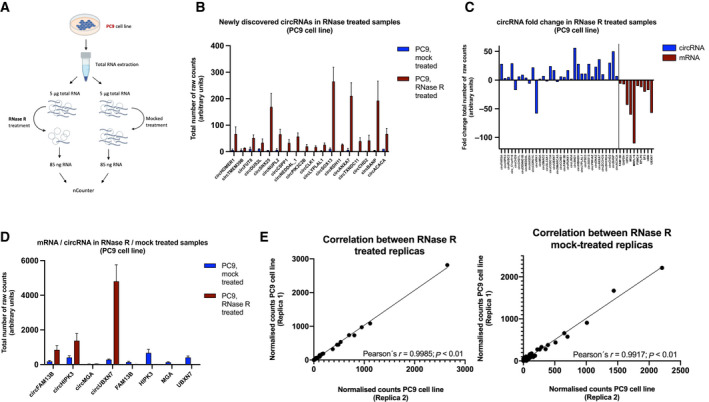
Fig. 1.

Analysis of circRNA from RNase‐R‐treated samples. (A) Workflow for circRNA enrichment with RNase‐R. (B) Representation of the newly discovered circRNAs after RNase‐R treatment. Bars indicate the mean of the replicas (n = 2). Error bars indicate SD. (C) CircRNA/linear HK fold‐change after RNase‐R treatment (n = 2). (D) Comparison of circRNAs/mRNA cognates in RNase‐R/mock‐treated samples. Bars indicate the mean of the replicas (n = 2). Error bars indicates SD. (E) Correlation of the nCounter replicas (n = 2) for each treatment. Pearson's coefficient is indicated.
