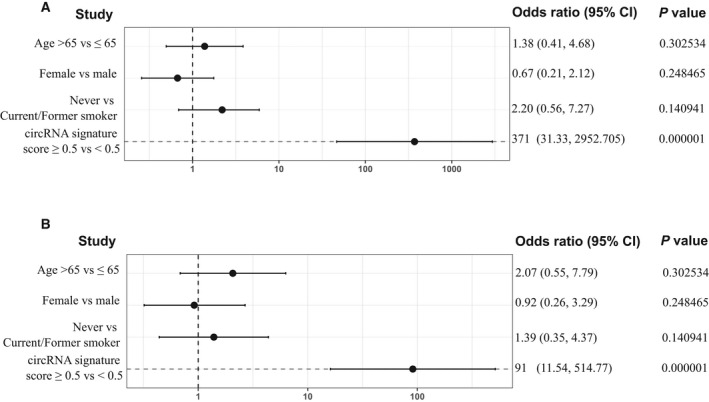
Fig. 7.

Univariate analysis exploring associations between patient characteristics and lung cancer to determine risk factor. Forest plot represents the odds ratios in (A) lung cancer; and (B), early‐stage lung cancer cohorts with a 95% Wald confidence limit. Student's t‐test was used for the calculation of P‐values.
