Fig. 6.

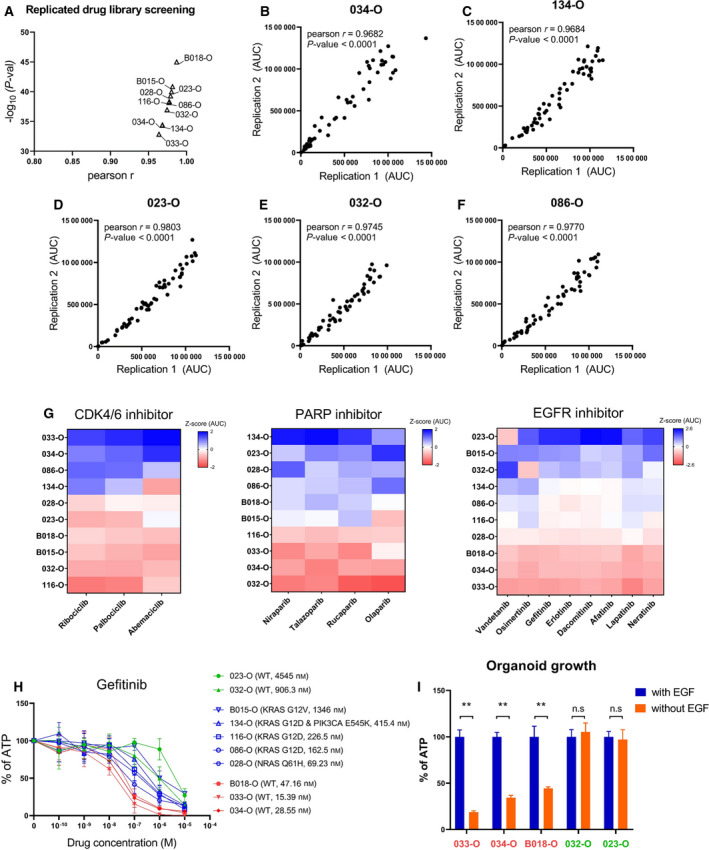
Screening of 57 FDA‐approved anticancer drugs for the treatment of standard therapy‐refractory PDOs. (A) Correlation of two independent drug screening results in 10 PDOs (median Pearson’s r = 0.978). (B–F) Representative data of replicated drug screening results (n = 2). Pearson’s r and P‐values were estimated using the Pearson correlation coefficient test. (G) Representative data of a similar response trend to molecular targeted drugs that share the same target in PDOs (n = 2). Three or four drugs that targeted CDK4/6 and PARP and eight drugs that targeted EGFR/HER2 produced similar responses in PDOs. The Z‐score was calculated using the area under the drug response curve, indicating the relative treatment efficiency. (H) Drug response curves for gefitinib in various PDOs in accordance with the presence of KRAS, NRAS, and PIK3CA oncogenic mutation (n = 2). Data are expressed as the mean ± SD. Y‐axis is the normalized ATP level relative to DMSO. (I) EGF ligand dependency in accordance with gefitinib sensitivity. Three gefitinib‐sensitive organoids (033‐, 034‐, and B018‐O) and two nonsensitive organoids (032‐ and 023‐O) displayed different growths when EGF was withdrawn from the culture medium. Data are expressed as the mean ± SD (n = 3). Y‐axis is the normalized ATP level relative to control medium containing EGF. P‐values were estimated using the Mann–Whitney test, **P‐val < 0.01. PDOs, patient‐derived organoids.
