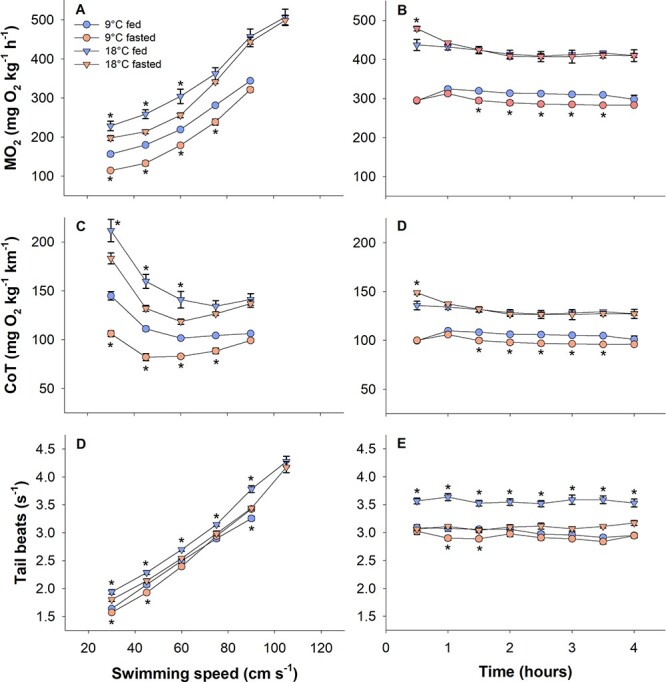
Figure 3.

Metabolic rates (ṀO2), CoT and tailbeat frequencies in the Ucrit (left panels) and sustained swim (right panels) trials. Statistical differences between fed and fasted fish within a specific temperature at different swim speeds or time points are indicated with asterisks (two-way ANOVA with Hold–Sidak post-hoc analyses, P < 0.05). N = 3 for ṀO2 and CoT measurements and N = 12 for tail beat frequencies. Data are mean ± s.e.m.
