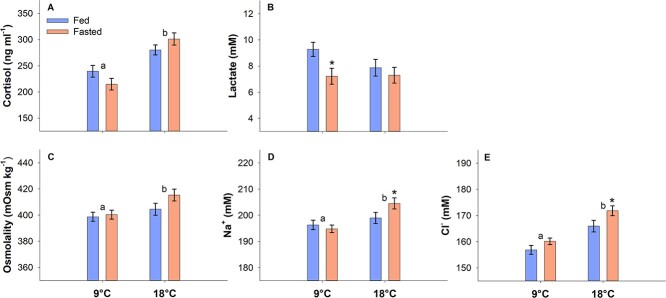
Figure 5.
Haematological parameters. Blood samplings were done on exhausted fish immediately after Ucrit measurements. Statistical differences between temperatures across feeding status are indicated with letters, and statistical differences between fed and fasted fish within a specific temperature are indicated with asterisks (two-way ANOVA with Hold–Sidak post-hoc analyses, P < 0.05). N = 24 and data are mean ± s.e.m.

