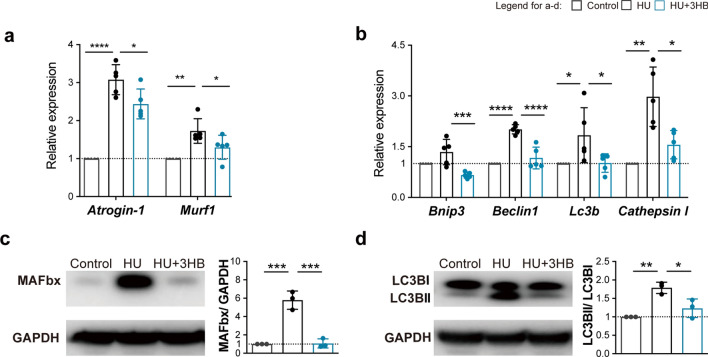
Fig. 2.
3HB inhibits the upregulation of ubiquitin–proteasome and autophagy-related atrogenes. a, b Real-time PCR analysis of Atrogin-1 and Murf1 (a) of Bnip3, Beclin1, Lc3b and Cathepsin l (b) in soleus muscles of mice in Control (ground control group), HU (hindlimb unloading mouse group), and HU + 3HB (hindlimb unloading mice fed with 50 mg/kg/days 3HB group) (n = 5). The legend box above b represents groups of Control (gray), HU (black), and HU + 3HB (blue). Western blot analysis of c Ubiquitin protein-Fbx32 (MAFbx) and GAPDH; d Autophagy protein-LC3b and GAPDH. The accompanying statistical plots for MAFbx/GAPDH and LC3bII/LC3bI are presented. Immunoblots are representative of the mean values obtained from intensity scans (see also Additional file 1: Fig. S1). Error bars are represented as mean ± SD (n = 3). One-way ANOVA was used for comparison between groups. ****P < 0.0001, ***P < 0.001, **P < 0.01, *P < 0.05, compared with HU mouse group

