Fig. 3.
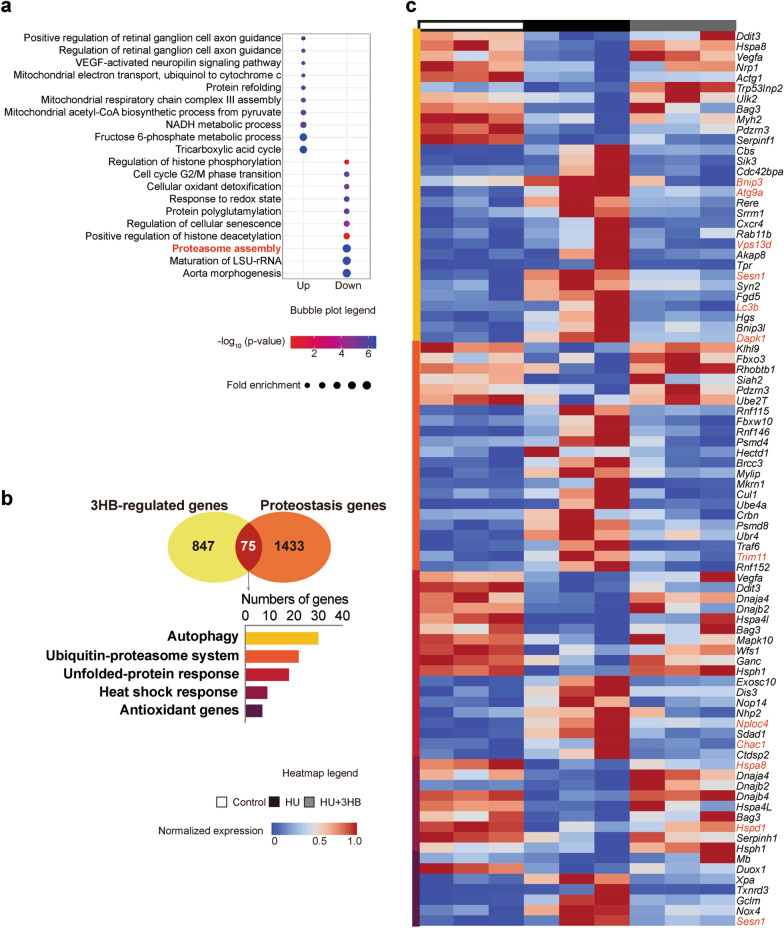
3HB prevents muscle protein degradation and maintains proteostasis. Transcriptomics analysis for soleus muscles of mice in Control (ground control group), HU (hindlimb unloading mouse group), and HU + 3HB (hindlimb unloading mice fed with 50 mg/kg/days 3HB group). n = 3 in each group. a Top 10 significantly enriched GO biological processes terms for the up-and down-regulated DEGs in the 3HB-regulated gene set (ranked according to fold enrichment). The bubble size represents gene count containing the amount of DEGs enriched in the pathway, and the bubble color represents the –log10 (p-value). b Venn diagram showing genes overlapped with the 3HB-regulated genes (defined in Additional file 1: Fig. S2) and a full gene set implicated in proteostasis pathways. c The bellowing bar chart shows 3HB-regulated proteostasis genes subdivided into individual pathways. Labels on the right of the heatmap show the gene names. Genes marked in red are the genes selected for separate analysis of FPKM represented gene expression level (Additional file 1: Fig. S3c–g). Detailed information for related gene lists, GO and KEGG analysis are included in Additional file 2: Table S1. The heatmap legend between 0 to 1 is shown in the middle, blue indicates low expression and red indicates high expression

