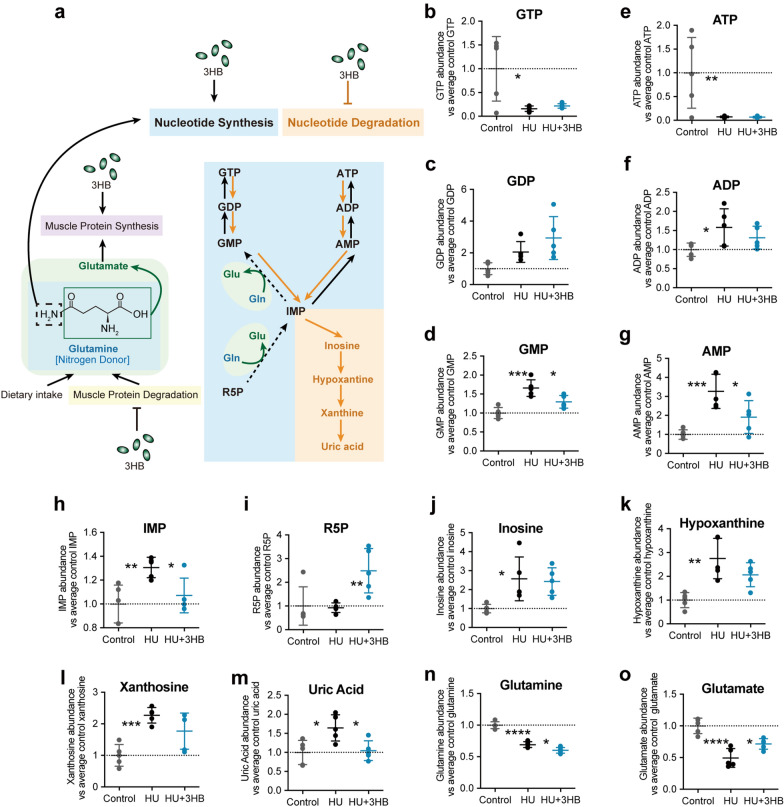
Fig. 5.
3HB participates in nucleotide metabolism and reduces uric acid accumulation in atrophied muscle. Effects of 3HB on skeletal muscle metabolism in soleus muscles of mice in Control (ground control group), HU (hindlimb unloading mouse group), and HU + 3HB (hindlimb unloading mice fed with 50 mg/kg/days 3HB group). For each identified metabolite, the raw data of peak area for each sample in the Control, HU, and HU + 3HB groups were normalized to the average peak area of the control group. a Schematic presentation of 3HB regulation in nucleotide metabolism in skeletal muscle [14]. The relative metabolite abundance for each metabolite between groups. b Relative abundance of guanosine triphosphate (GTP). c Relative abundance of guanosine diphosphate (GDP). d Relative abundance of guanosine monophosphate (GMP). e Relative abundance of d-ribulose-5-phosphate (R5P). f Relative abundance of adenosine triphosphate (ATP). g Relative abundance of adenosine diphosphate (ADP). h Relative abundance of adenosine monophosphate (AMP). i Relative abundance of inosinic acid (IMP). j Relative abundance of inosine. k Relative abundance of hypoxanthine. l Relative abundance of xanthine. m Relative abundance of uric acid. n Relative abundance of glutamate. o Relative abundance of glutamine. Error bars are represented as mean ± SD (n = 5). one-way ANOVA was used for comparison between groups. ****P < 0.0001, ***P < 0.001, **P < 0.01, *P < 0.05, compared with HU mouse group. Raw data of identified metabolites and normalized data for nucleotide metabolism are listed in Additional file 3: Table S2

