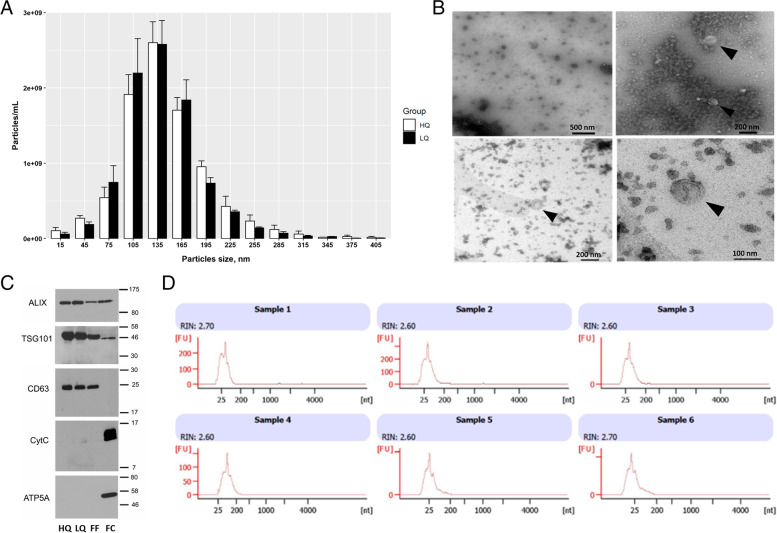
Fig. 2.
Morphological and molecular characterization of s-EVs. A The concentration and size distribution of s-EVs isolated from follicular fluids (FFs) corresponding to high- (HQ) or low-quality (LQ) oocytes analysed by NTA. B Transmission electron microscopy (TEM) representative photos of isolated s-EVs showing the lipid bilayer membrane and the cup-shaped EV particles (black arrows). Scale bar of 500 and 200 nm for the upper left and right photos, respectively, and of 200 and 100 nm for the lower left and right photos, respectively). C Immunoblotting analysis of EV-specific protein markers (ALIX, TSG101, and CD63) and cellular specific protein markers (CytC and ATP5A) in the HQ and LQ EV groups, as well as in filtered FF and follicular cell lysate (FC) as positive and negative controls, respectively. Scale numbers are in kDa. D RNA size distribution from s-EV samples of HQ (sample 1–3) and LQ (sample 4–6) groups analysed with a bioanalyzer (Agilent Technologies)

