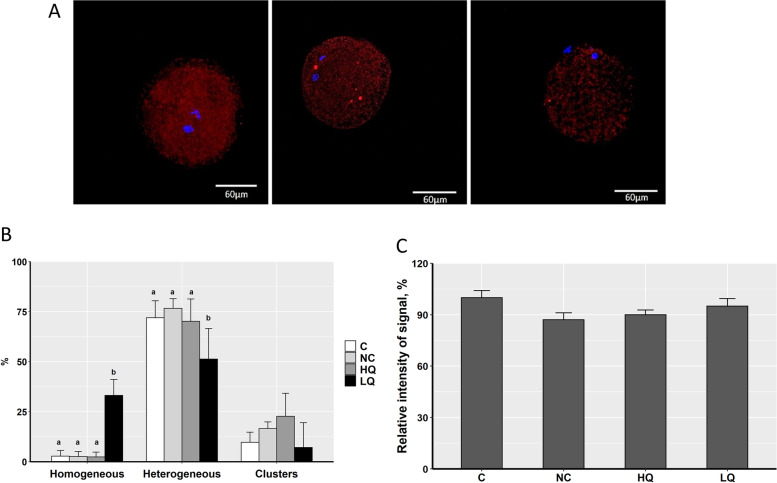
Fig. 7.
Mitochondrial activity and distribution patterns in porcine MII oocytes. A Oocytes were classified into three main distribution patterns: Homogeneous (left), Heterogeneous (middle), or Cluster (right). Scale bar, 60 μm. B The proportion of each distribution pattern in porcine MII oocytes after co-incubation with s-EVs of high- or low-quality groups. Bars with different letters indicate significant differences (P < 0.05). C The relative intensity signal of mitochondrial activity in the different oocyte groups. C: control; NC: negative control; HQ: high-quality; LQ: low-quality

