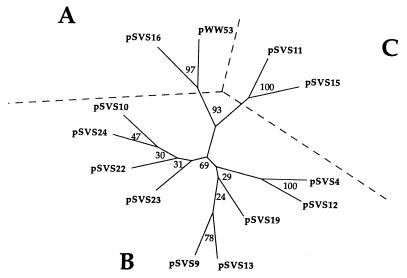
FIG. 6.
Dendrogram illustrating the relationships among pSVS plasmids and pWW53 based on their RFLP patterns, generated by cutting with EcoRI. Clustering analysis was performed on the multiple data set by using DOLLOP. Bootstrapping values are shown in the nodes. Note that the plasmids are clustered in a manner similar to the arrangement based on the restriction analysis of their catabolic genes (Fig. 3).

