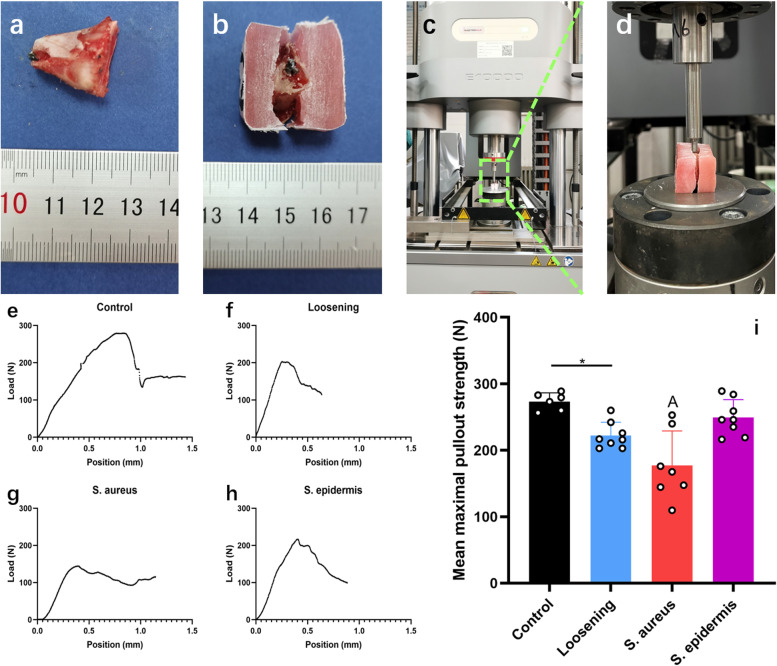
Fig. 1.
Pullout test. a Soft tissue was removed from the tibia. b The bone block was fastened by denture acrylic. c Distant view of the machine. d Close-up view of the objective table. e Representative image of the pullout strength of the control group. f Representative image of the pullout strength of the loosening group. g Representative image of the pullout strength of the S. aureus group. h Representative image of the pullout strength of the S. epidermidis group. i Mean maximal pullout strength of the four groups. *, P < 0.05; A, significantly different from other groups (P < 0.05)

