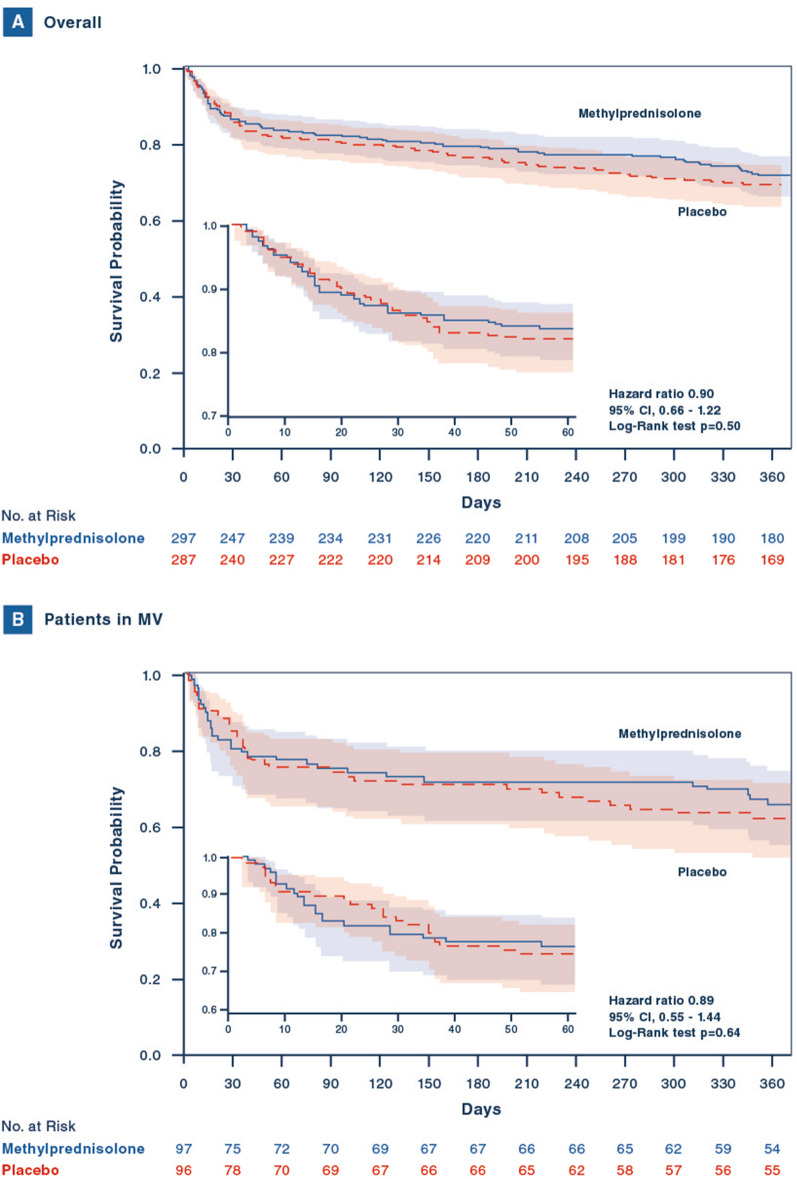
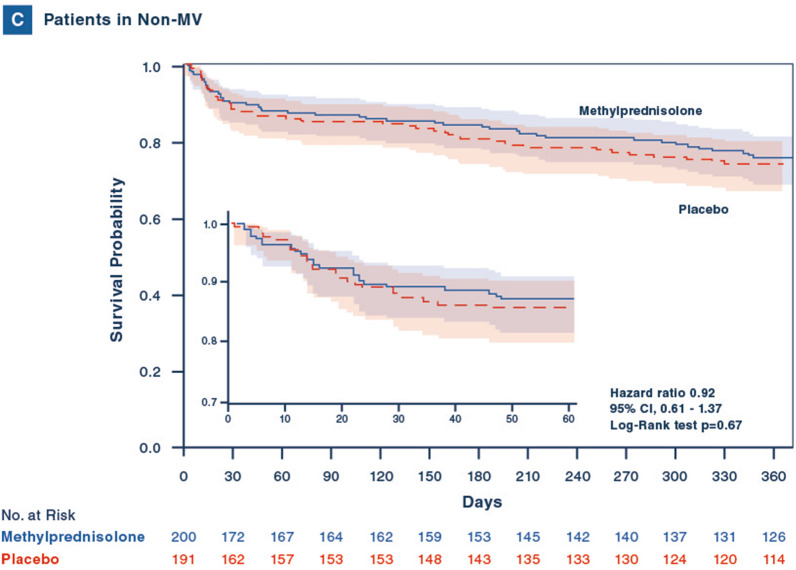
Fig. 2.
Kaplan–Meier estimate of survival. Kaplan–Meier estimates of survival are shown in the overall population (A), in patients who were receiving mechanical ventilation at randomization (Patients on MV; B), and in those not receiving mechanical ventilation at randomization (Patients not on MV; C). The inset in each panel shows the same data on an enlarged y axis and up to day 60


