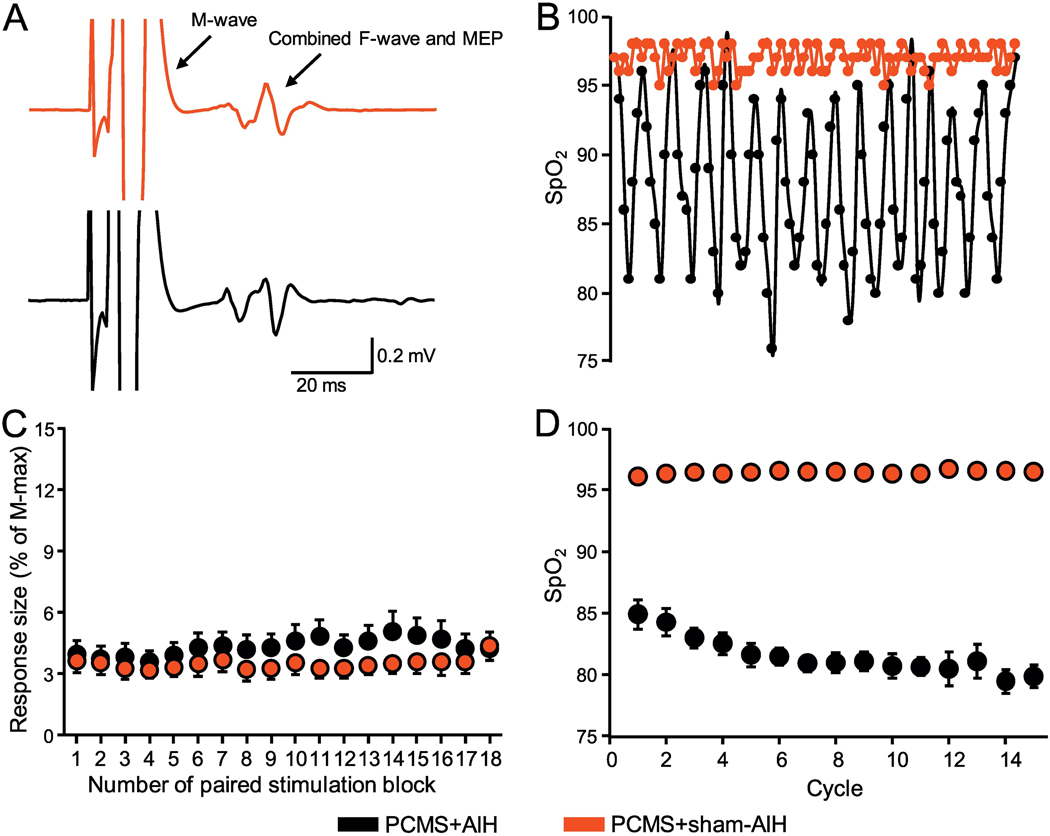
Figure 3. Monitoring during protocols.
(A) Raw traces from the FDI muscle during PCMS+sham-AIH and PCMS+AIH. Note that the M-wave is followed by an F-wave that is likely to be combined with a MEP elicited by TMS. (B) SpO2 from a representative participant during the PCMS+sham-AIH (red) and PCMS+AIH (black) protocols. The AIH protocol consisted of 15 cycles of 1 min of inspiring ambient air (20.9% O2) with 1 min of hypoxic air (9.4% O2). (C) The abscissa shows the number of pairs of stimuli during each protocol (a total of 180 pairs of stimuli). At each point, the average of 10 responses is shown. The ordinate shows the size of the conditioned response expressed as % of the M-max in SCI participants during PCMS+sham-AIH and PCMS+AIH. (D) Group data showing the SpO2 observed during the 15 cycles in the PCMS+sham-AIH (red) and PCMS+AIH (black) protocol.

