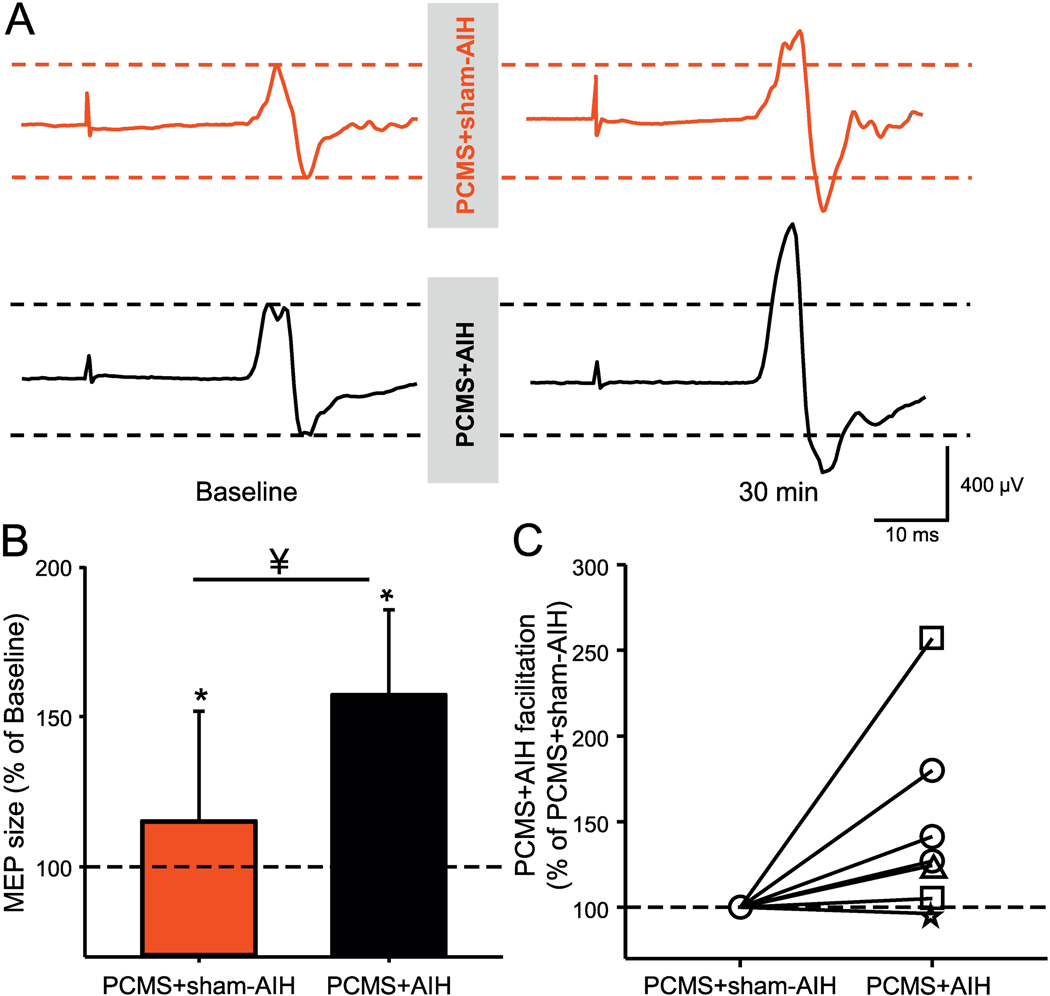
Figure 5. MEPs elicited by electrical stimulation at the cervicomedullary level.
(A) Raw MEPs traces recorded from the FDI muscle of a representative SCI participant before and 30 min after PCMS+sham-AIH (red traces) and PCMS+AIH (black traces). Waveforms represent the average of 20 MEPs. (B) The graph shows group data (n=9) with the abscissa showing the protocols tested (PCMS+sham-AIH=red bar and PCMS+AIH=black bar) and the ordinate showing the size of MEPs expressed as % of MEPs at baseline. (C) Graph shows individual data (AIS A=triangle, AIS B=star, AIS C=square, and AIS D=circle). The ordinate shows the % of changes in MEP amplitude after PCMS+AIH expressed as a % of the facilitation after PCMS+sham-AIH. The dotted line indicates the baseline. Error bars indicate SDs. *p<0.05, comparison with baseline; ¥p<0.05, comparison between PCMS+sham-AIH and PCMS+AIH protocols.

