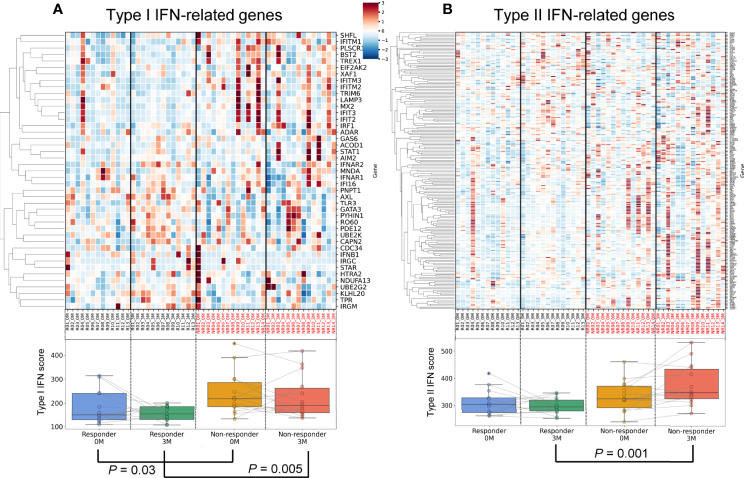
Figure 3.
Differences in and dynamics of type I and II interferon signatures. An upper heatmap shows the expression of type I IFN-related genes (A) and type II IFN-related genes (B). The expression of each gene (CPM) related to the type I IFN signature was standardized across all samples, and Z scores were shown. Lower box plots show the type I IFN score (A) and type II IFN score (B) for each specimen.

