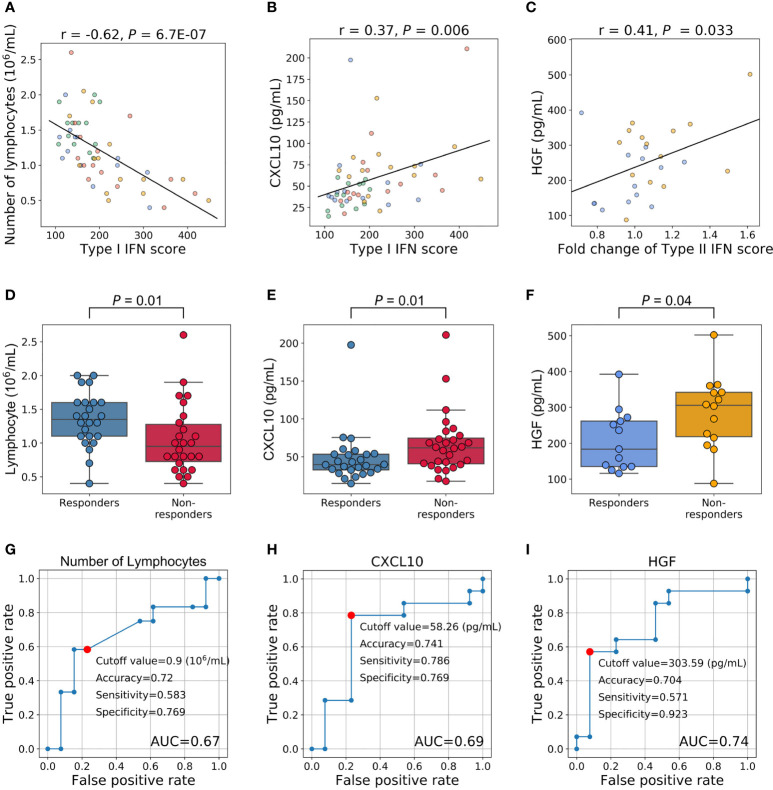
Figure 4.
Relationships between the IFN signature and other phenotypes and an evaluation of their clinical utility as predictive markers. (A–C) Relationships between IFN scores and other phenotypes. Each dot represents each specimen. Blue represents responders before treatment, orange for non-responders before treatment, green for responders three months after treatment, and red for non-responders three months after treatment. (D, E) Relationships between treatment responses and the number of lymphocytes and CXCL10 levels. Fifty-four specimens (27 samples × 2 timepoints) were analyzed. (F) Relationship between HGF levels before treatment and treatment responses. (G–I) ROC curves for no response to TNFi. Red plots indicate the cut-off points at the highest accuracy (minimum false negative and false positive results) for predicting non-responders.

