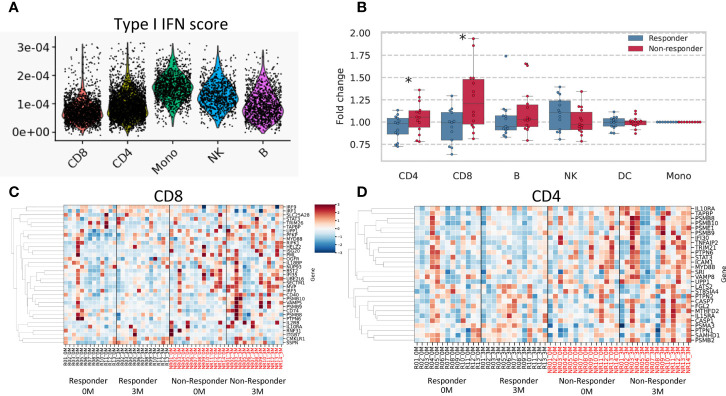
Figure 6.
Results of single-cell data and a deconvolution analysis of the IFN signature. (A) Type I IFN scores for each cell subtype are shown. (B) Fold changes (after/before treatment) in the mean expression of type II IFN-related genes are shown according to each cell subtype. A heatmap of estimated expression in cells positive for CD8 (C) and CD4 (D). The estimated expression of each gene was standardized across all samples, and Z scores were shown. * stands for p < 0.05 by the Mann-Whitney U test. CD4, CD4-positive cells; CD8, CD8-positive cells; B, B cells; DC, Dendritic cells; NK, Natural killer cells.

