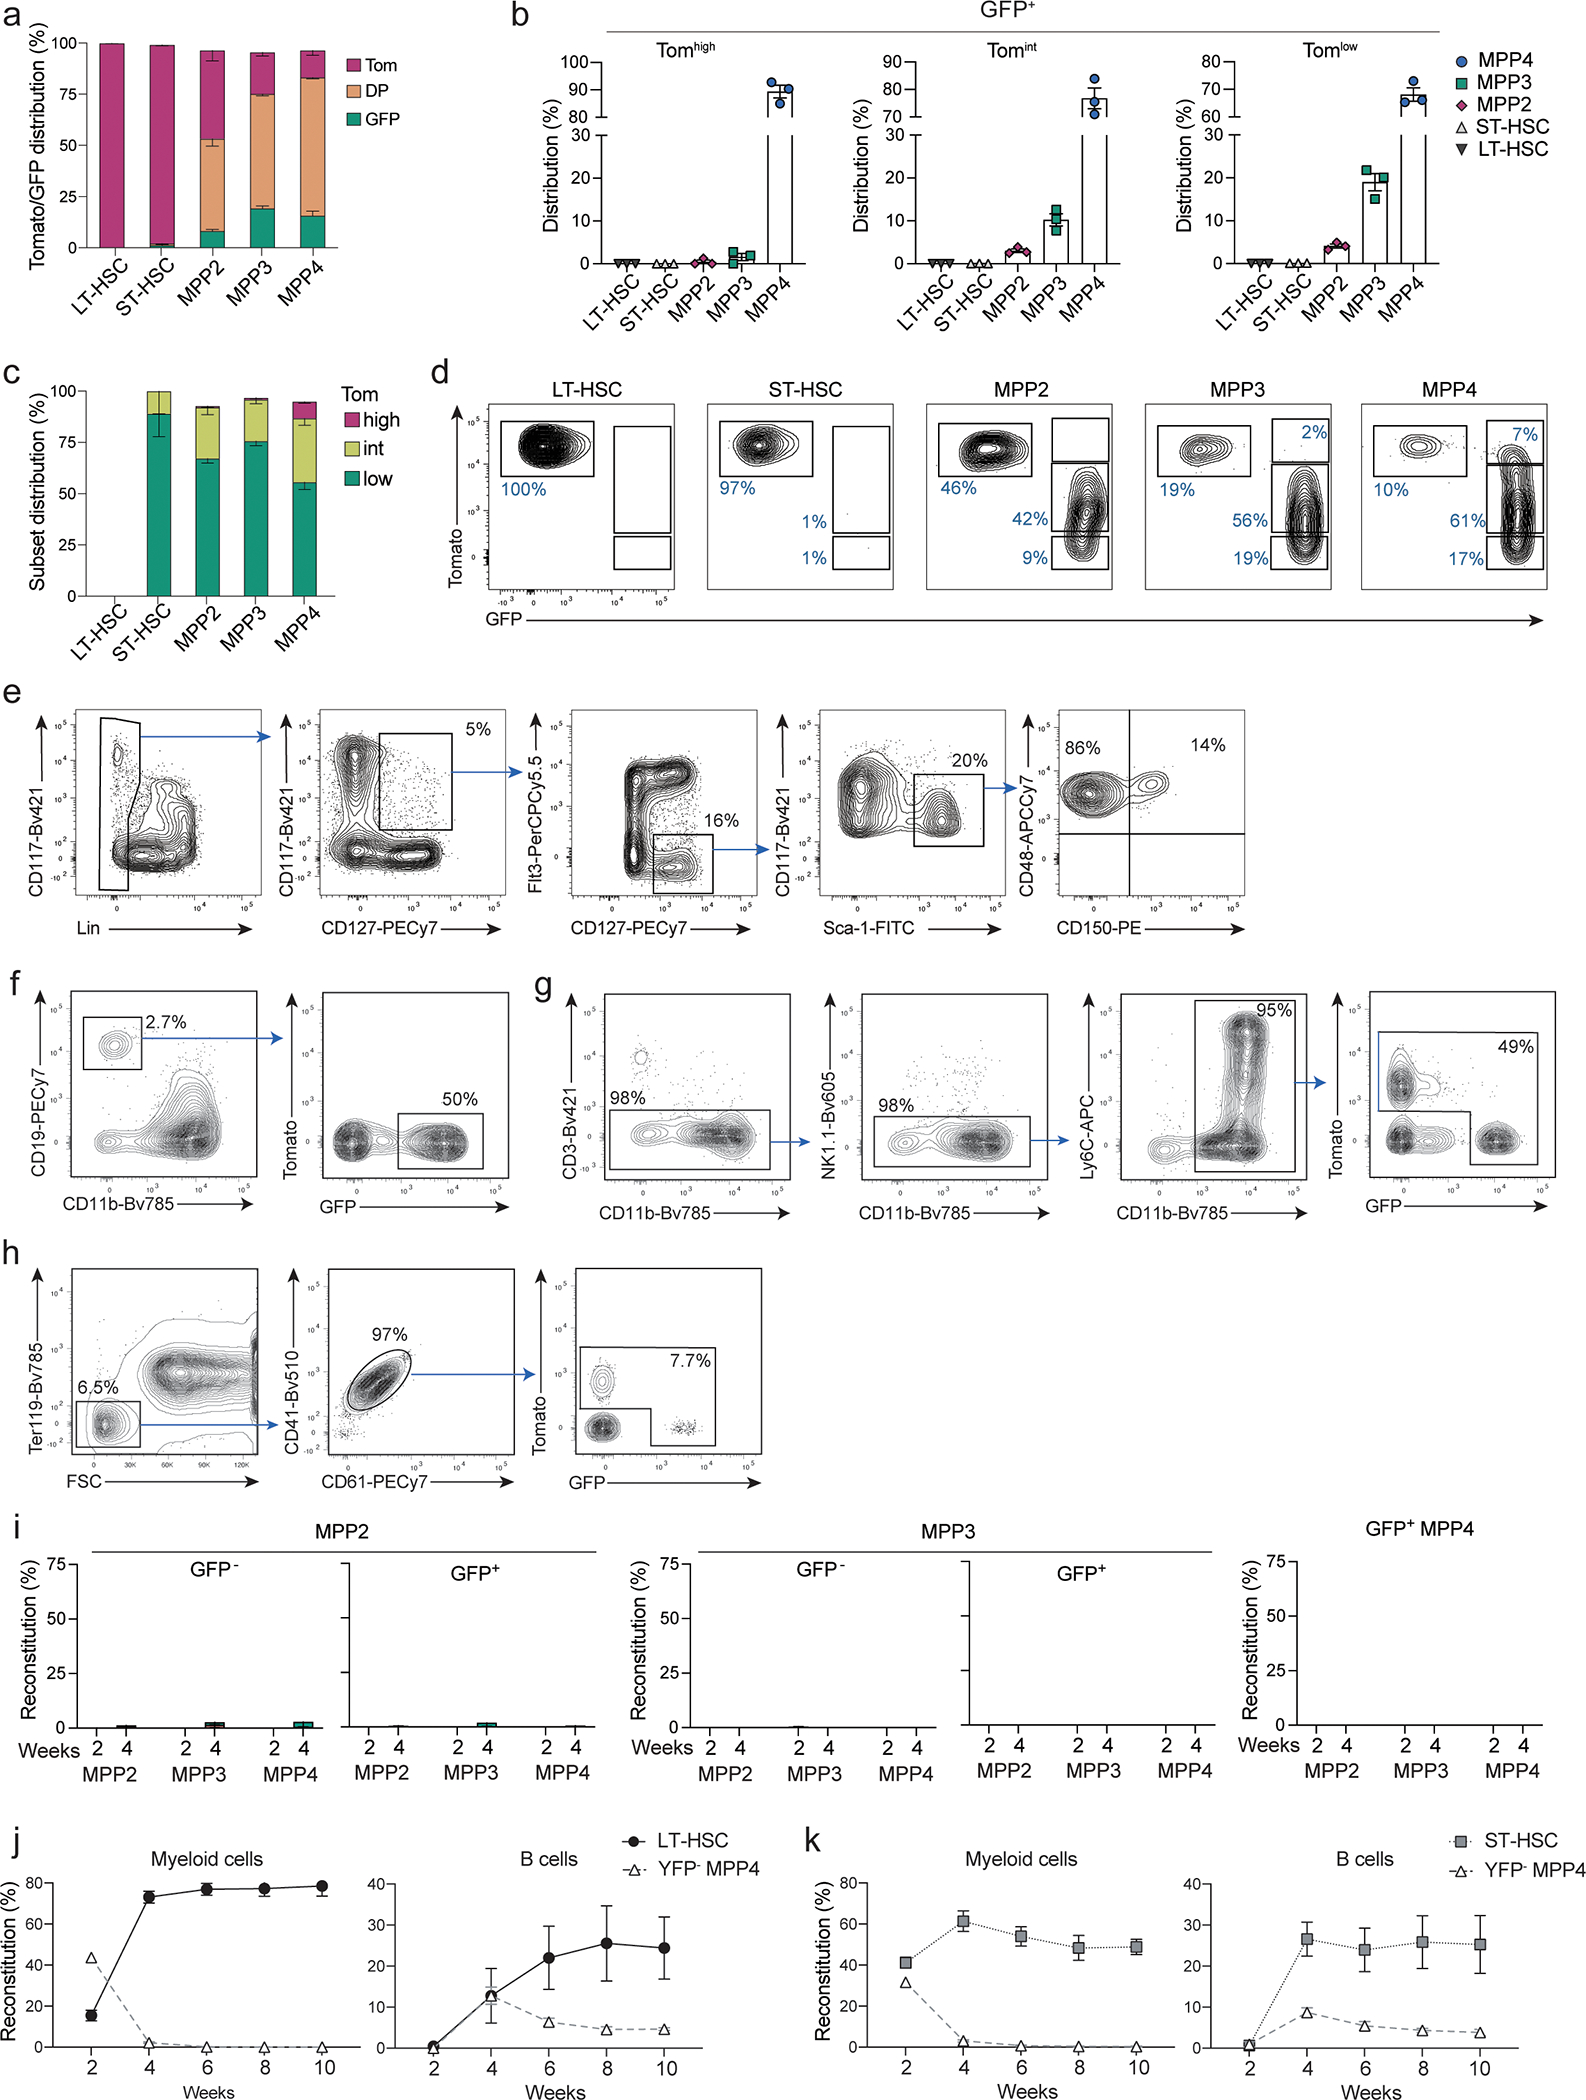
Extended Data Fig. 3. Reduced self-renewal capacity of YFP− MPP4s.

(a-b) BM cells from 6–8 weeks old TdTmTmG mice were analyzed for the expression of Tomato and GFP. (a) Shown are representative histograms for Tomato expression from 2 independent experiments (n=3) for LT-, ST-HSC and GFP+ MPPs, CLPs and GMPs gated as in Fig. 2c; Extended Data 2f. (b) Two color histograms showing the expression of FLT3 and CD150 (right panels top row) or CD48 and CD150 (right panels bottom row) of LSK pre-gated as TomatohiGFP− (black), TomatohiGFP+ (red), TomatointGFP+ (Yellow), TomatolowGFP+ (green) as shown in the left plot.
(c) B- (top plot) and myeloid (bottom plot) precursor frequency determined by in vitro limiting dilution assays for MPP2s, MPP3s, and MPP4s (gated as in Fig. 2c) isolated from the BM of 6–8 weeks old TdTYFP mice. MPP subsets are sorted as YFP− or YFP+ as indicated. Shown is one representative experiment (n=3).
(d-e) 4000 MPPs (gated as in Fig. 2c) were isolated from the BM of 6–8 weeks old TdTmTmG mice and transferred intra venously (i.v.) into sub-lethally irradiated WT recipients. Shown is the reconstitution for each GFP+ or GFP− MPP subset as indicated. (d) Percent reconstitution curves in peripheral blood of recipient animals for B cells (CD19+, CD11b−), myeloid cells (CD11b+, CD3−, NK1.1−) and platelets (FSClow, Ter119−, CD41+, CD61+) determined at the indicated timepoints after transfer: day 7, 10, 14, 21, and 28 for platelets and on days 10, 14, 21, and 28 for B and myeloid cells. Shown are cumulative data from 3–6 independent experiments n=2–17 (e) Shown are percent reconstitution of recipient animals for mature subsets (gated as in Extended Data 2a–d) after two and four weeks in the bone marrow (pro-Erythrocytes), peripheral blood (platelets) and spleen (all other subsets). Shown are cumulative data from 3 independent experiments per timepoint. Error bars indicate s.e.m.
(f) 4000 GFP− MPP4s were transferred into sub-lethally irradiated WT recipients. Shown are percent reconstitution in the bone marrow of recipient animals of Tomato+ (red bars) and GFP+ (green bars) MPP2s, MPP3s and MPP4s after two and four weeks. (Cumulative from 2 independent experiments. Two weeks n=10, four weeks n=7). Error bars indicate s.e.m.
