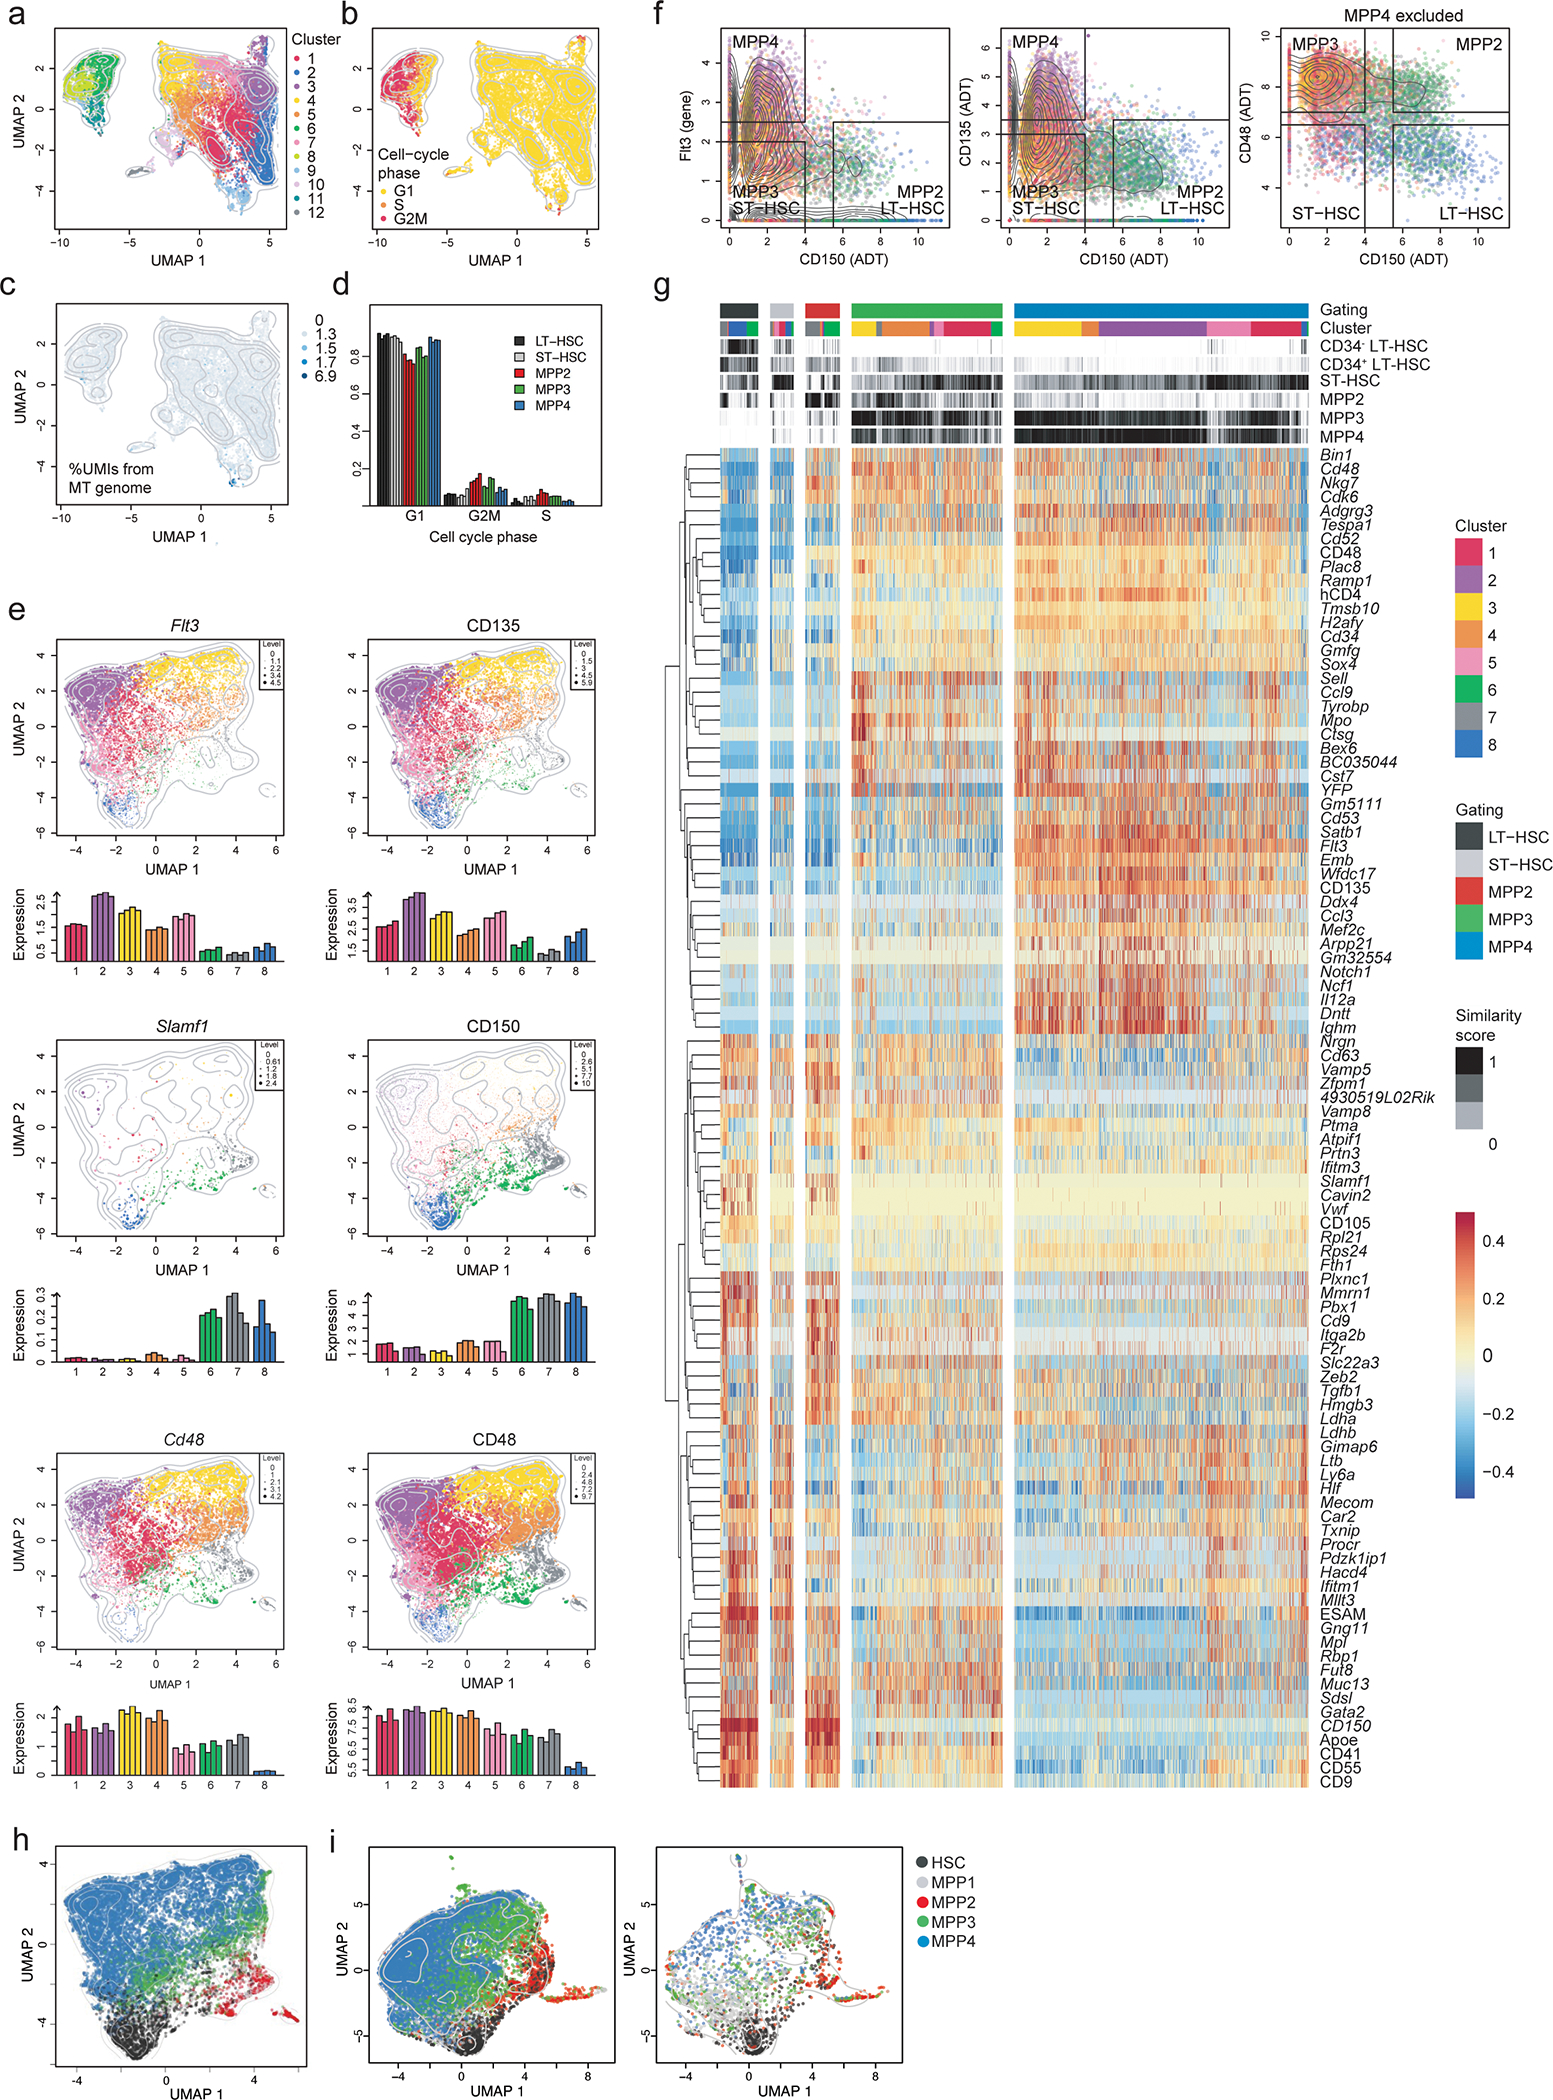
Extended Data Fig. 4. HSC and MPP transcriptional profiling using a posteriori gating.

LSK cells isolated from BM of four 6–8 weeks old TdThCD4/YFP double reporter mice were used for single-cell RNA sequencing in combination with CITE-Seq labelling as described in the methods.
(a-c) Hierarchical clustering analysis was performed and projected in a 2-dimensional space using UMAP as explained in the methods. Each color represents a specific cluster as indicated. (a) Hierarchical clustering identified 12 clusters. (b) Cell-cycle phase, represented by the colors yellow (G1), orange (S) and red (G2), of each cell was determined as described in the methods. (c) Unique molecular identifiers (UMIs) coming from the mitochondrial (MT) genome were quantified across cells, reflected by the color intensity. Contour lines display the 2D cell density on the UMAP space.
(d) Shown is a bar plot distribution indicating the frequency of cells in the different phases of the cell cycle across subsets obtained for the “a posteriori gating defined as in Fig. 4b.
(e) UMAP and bar graphs illustrating the scaled expression of the Flt3, Slamf1, and Cd48 mRNA (left panels), as well as the expression of their corresponding surface markers used for CITE-Seq (right panels). The colors represent cells from the different clusters. Dot size and color intensity indicate expression levels. Bar height in bar graphs indicate the average expression across cells from each biological replicate across clusters.
(f) A posteriori gating strategy used to define HSC and MPP populations within the CITE-Seq data. For MPP4: Flt3 > 2.5, CD135 > 3.5, and CD150 < 4. For MPP3: Flt3 < 2, CD135 < 3, CD150 < 4, and CD48 > 7. For MPP2: Flt3 < 2.5, CD135 < 3.5, CD150 > 5.5, and CD48 > 7. For LT-HSC: Flt3 < 2.5, CD135 < 3.5, CD150 > 5.5, and CD48 < 6.5. For ST-HSC: Flt3 < 2, CD135 < 3, CD150 < 4, and CD48 < 6.5. The colors represent cells from the different clusters.
(g) Heatmap displaying the centered and scaled expression of the top differentially expressed genes between the gated populations defined as in (e), resulting in a list of 96 markers. Cells were ordered following the hierarchical clustering tree. Cluster assignment and similarity score of each cell to reference ImmGen RNA-seq samples is shown on top of the heatmap.
(g) Shown is the UMAP distribution of our single cell dataset assigned using the previously published bulk RNA-Seq obtained from sorted progenitors (see gates below) from ref 29.
(i) Shown is the UMAP distribution for the integrated analysis of our dataset with the previously published scRNA-Seq obtained from ref34 obtained using the Seurat package (findIntegrationAnchors function) 35. On the left the overlay of the two data sets on the right the scRNA-Seq obtained from ref34.
