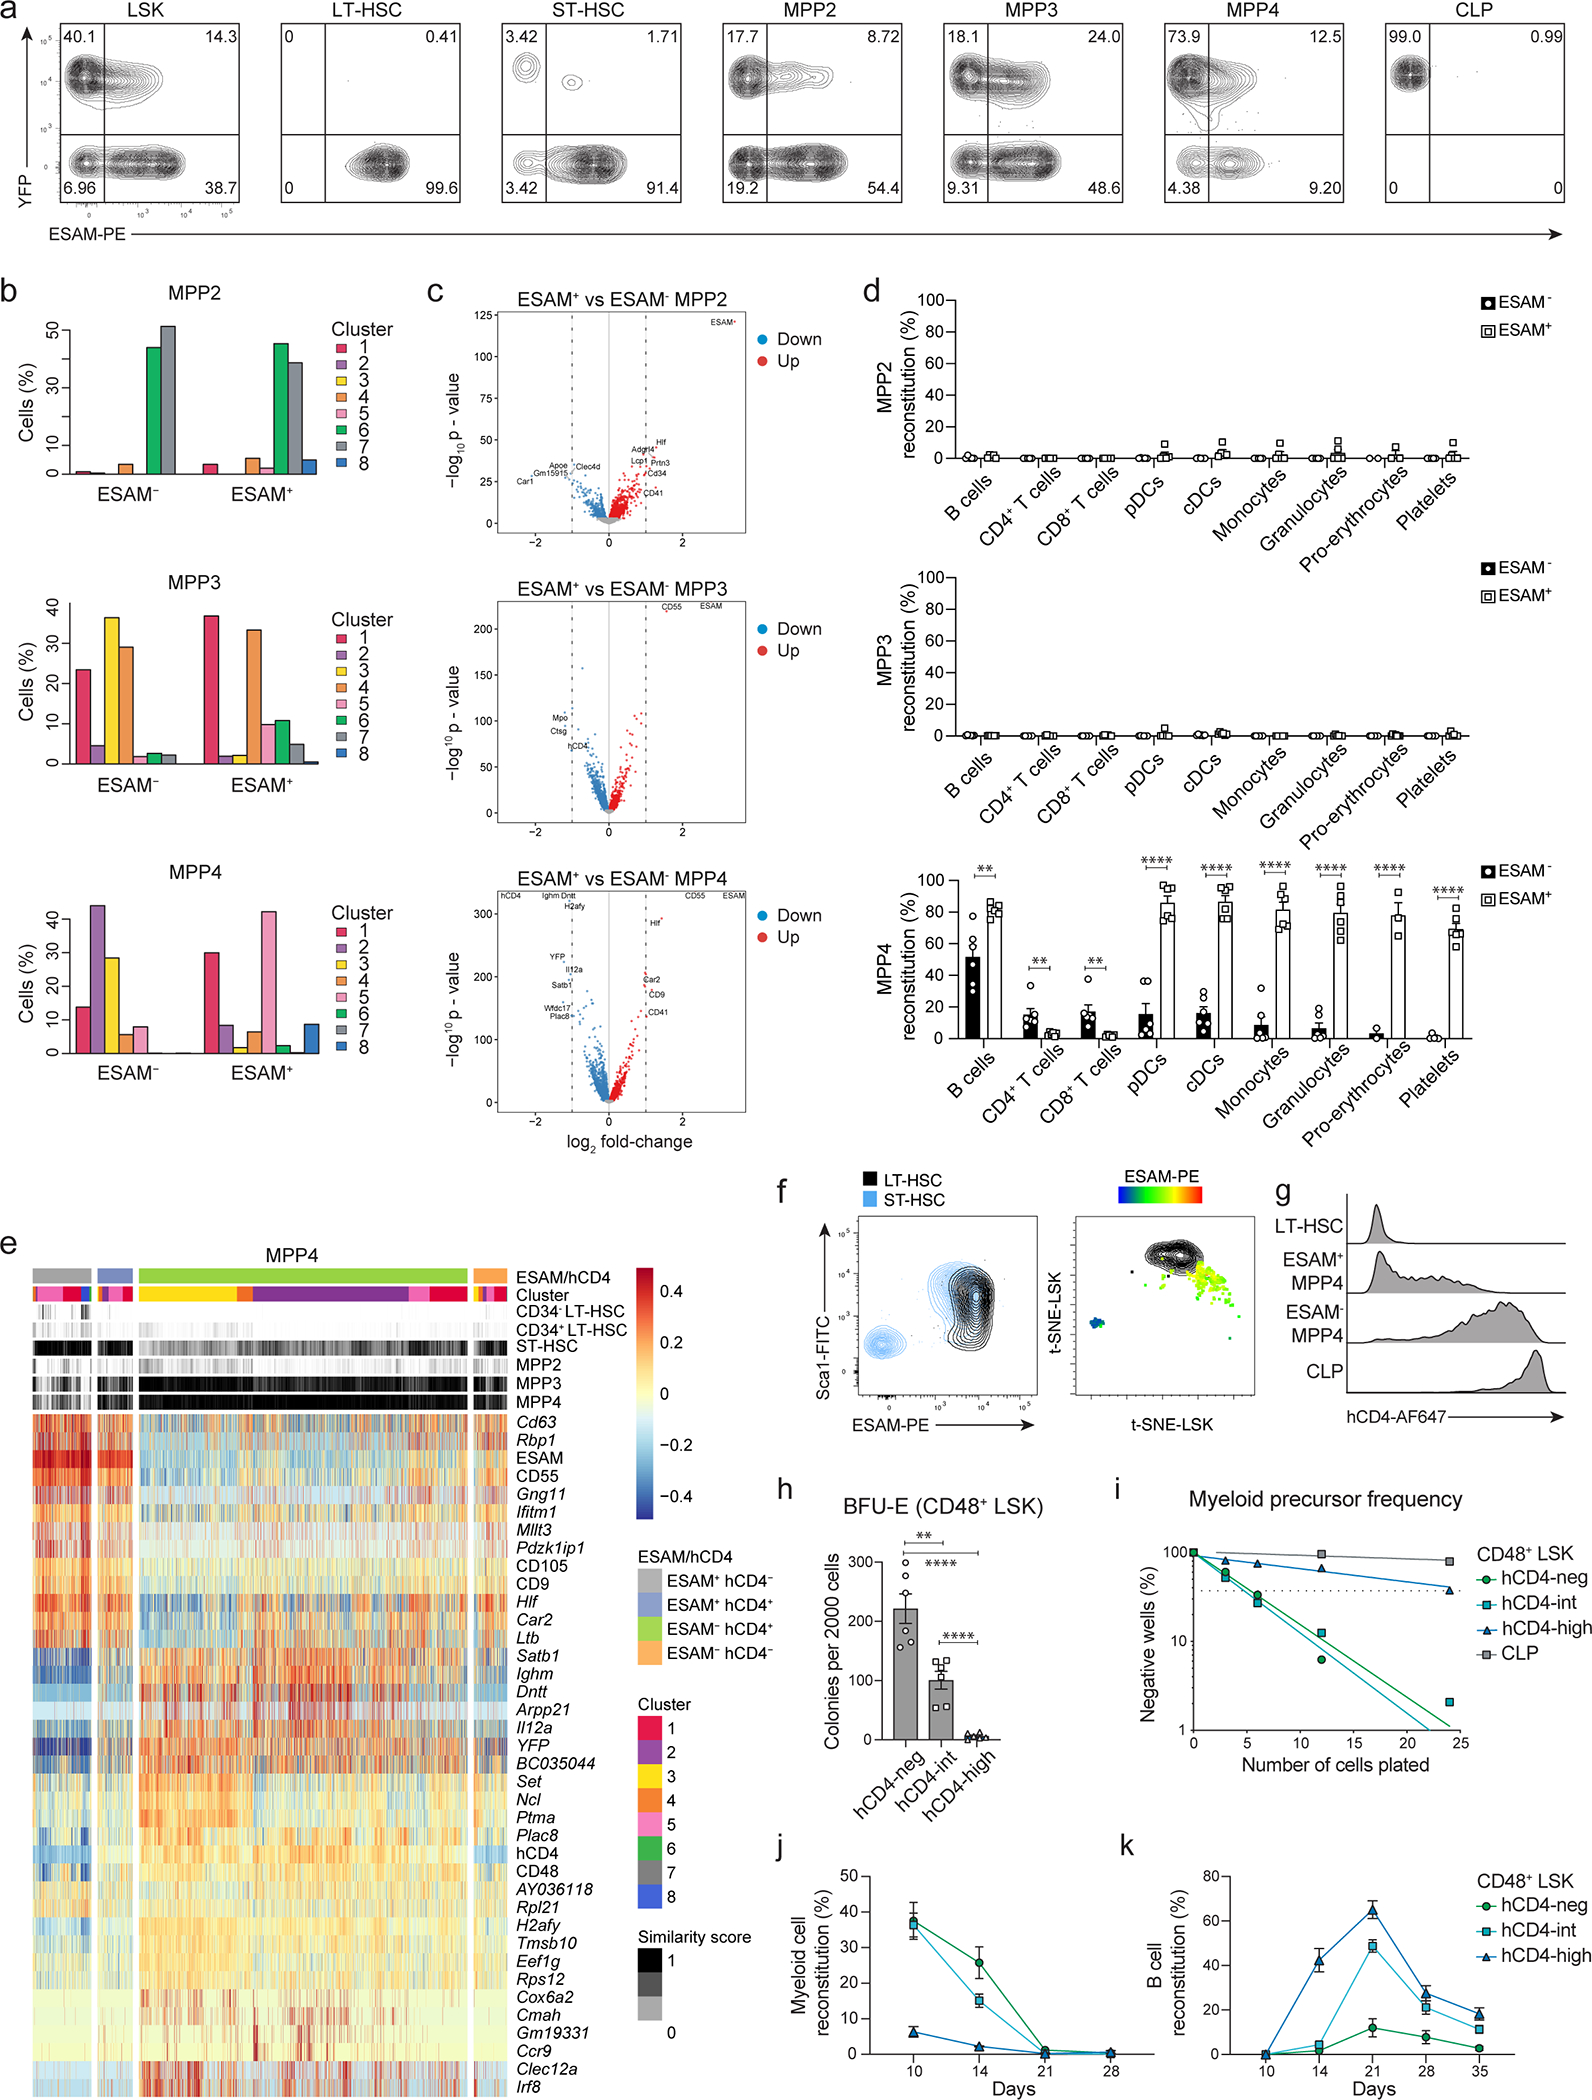
Extended Data Fig. 7. ESAM defines the developmental hierarchy of MPPs.

(a) Two color histograms depicting the expression of YFP and ESAM from BM cells of 6–8 weeks old TdThCD4/YFP mice. Cells are pre-gated as shown in Fig. 2c.
(b-c) Progenitors were defined using the “a posteriori” gating (Extended Data 4f) as ESAM negative and positive MPP2s (top) MPP3s (middle) and MPP4s (bottom). (b) Shown is the distribution with the frequency across clusters for each subset. (c) Shown are volcano plots projecting the difference in gene expression for each subset. Genes downregulated in the ESAM− fractions with an FDR<0.01 are marked in blue and genes upregulated in the ESAM+ fractions are marked in red. Genes with an abs log2 FC>1 are labeled.
(d) 4000 ESAM negative and positive MPP2s (top) MPP3s (middle) and MPP4s (bottom) were isolated from the BM of 6–8 weeks old Rosa26mTmG mice and transferred i.v. into sub-lethally irradiated WT recipients. Shown are cumulative data with percent reconstitution of recipient animals for mature subsets (gated as shown in Extended Data 2a–d) after four weeks in the bone marrow (pro-Erythrocytes), peripheral blood (platelets) and spleen (all other subsets). Data were collected from 3 independent experiments. A multiple two-tailed unpaired Student`s t test was performed (MPP4: B cells P=0.003, CD4+ T cells P=0.0097, CD8+ T cells P=0.005, pDCs P=0.000005, monocytes P=0.000001, pro-erythrocytes P=0.006). **, P < 0.01; ****, P < 0.0001. Error bars indicate s.e.m.
(e) Compiled data showing ESAM+hCD4−, ESAM+hCD4+, ESAM−hCD4+, and ESAM−hCD4− MPP4s, annotated based on the “a posteriori” gating as in (Extended Data 4f), in relation to their cluster distribution defined as in Fig. 4a; the similarity score to reference samples from the ImmGen dataset defined as in Fig. 4c; The top 38 differentially expressed markers and genes between subsets is centered and scaled.
(f) Representative histograms illustrating the expression levels of hCD4 within LT-HSCs, ESAM+ and ESAM− MPP4s, and CLPs isolated from the BM of 6–8 weeks old TdThCD4 mice.
(g) Shown is the expression of Sca-1 and ESAM for LT- and ST-HSCs (Left plot) gated as shown in Fig. 2c. LT- (in black) and ST-HSCs (color scale) are projected into a t-SNE plot. ST-HSCs are projected indicating the expression of ESAM.
(h-k) CD48+ LSKs isolated from the BM of 6–8 weeks old TdThCD4 mice were sorted based on the expression of hCD4 as indicated. (h) 2000 cells were analyzed for erythroid colony forming potential (BFU-E). Shown are the number of colonies obtained. Data were collected from 3 independent experiments (n=6). Statistical analysis was done with two-tailed unpaired Student`s t test (hCD4-neg and hCD4-int P=0.002). *, P < 0.05; **, P < 0.01; ***, P < 0.001; ****, P < 0.0001. Error bars indicate s.e.m.. (i) Myeloid precursor frequency was determined for the indicated subsets by in vitro limiting dilution analysis, as described in methods. Shown is one representative experiment (n=3). Error bars indicate s.e.m. (j, k) 4000 cells were transferred i.v. into sub-lethally irradiated WT-CD45.1 recipients in competition with 4000 hCD4-neg CD48+ LSK cells sorted from TdThCD4-CD45.1/2 mice. Shown is the percent peripheral blood reconstitution for CD11b+CD3−NK1.1− myeloid (j) and CD19+CD11b− B cells (k) at the indicated timepoints after transfer. Data were collected from 3 independent experiments. Error bars indicate s.e.m.
