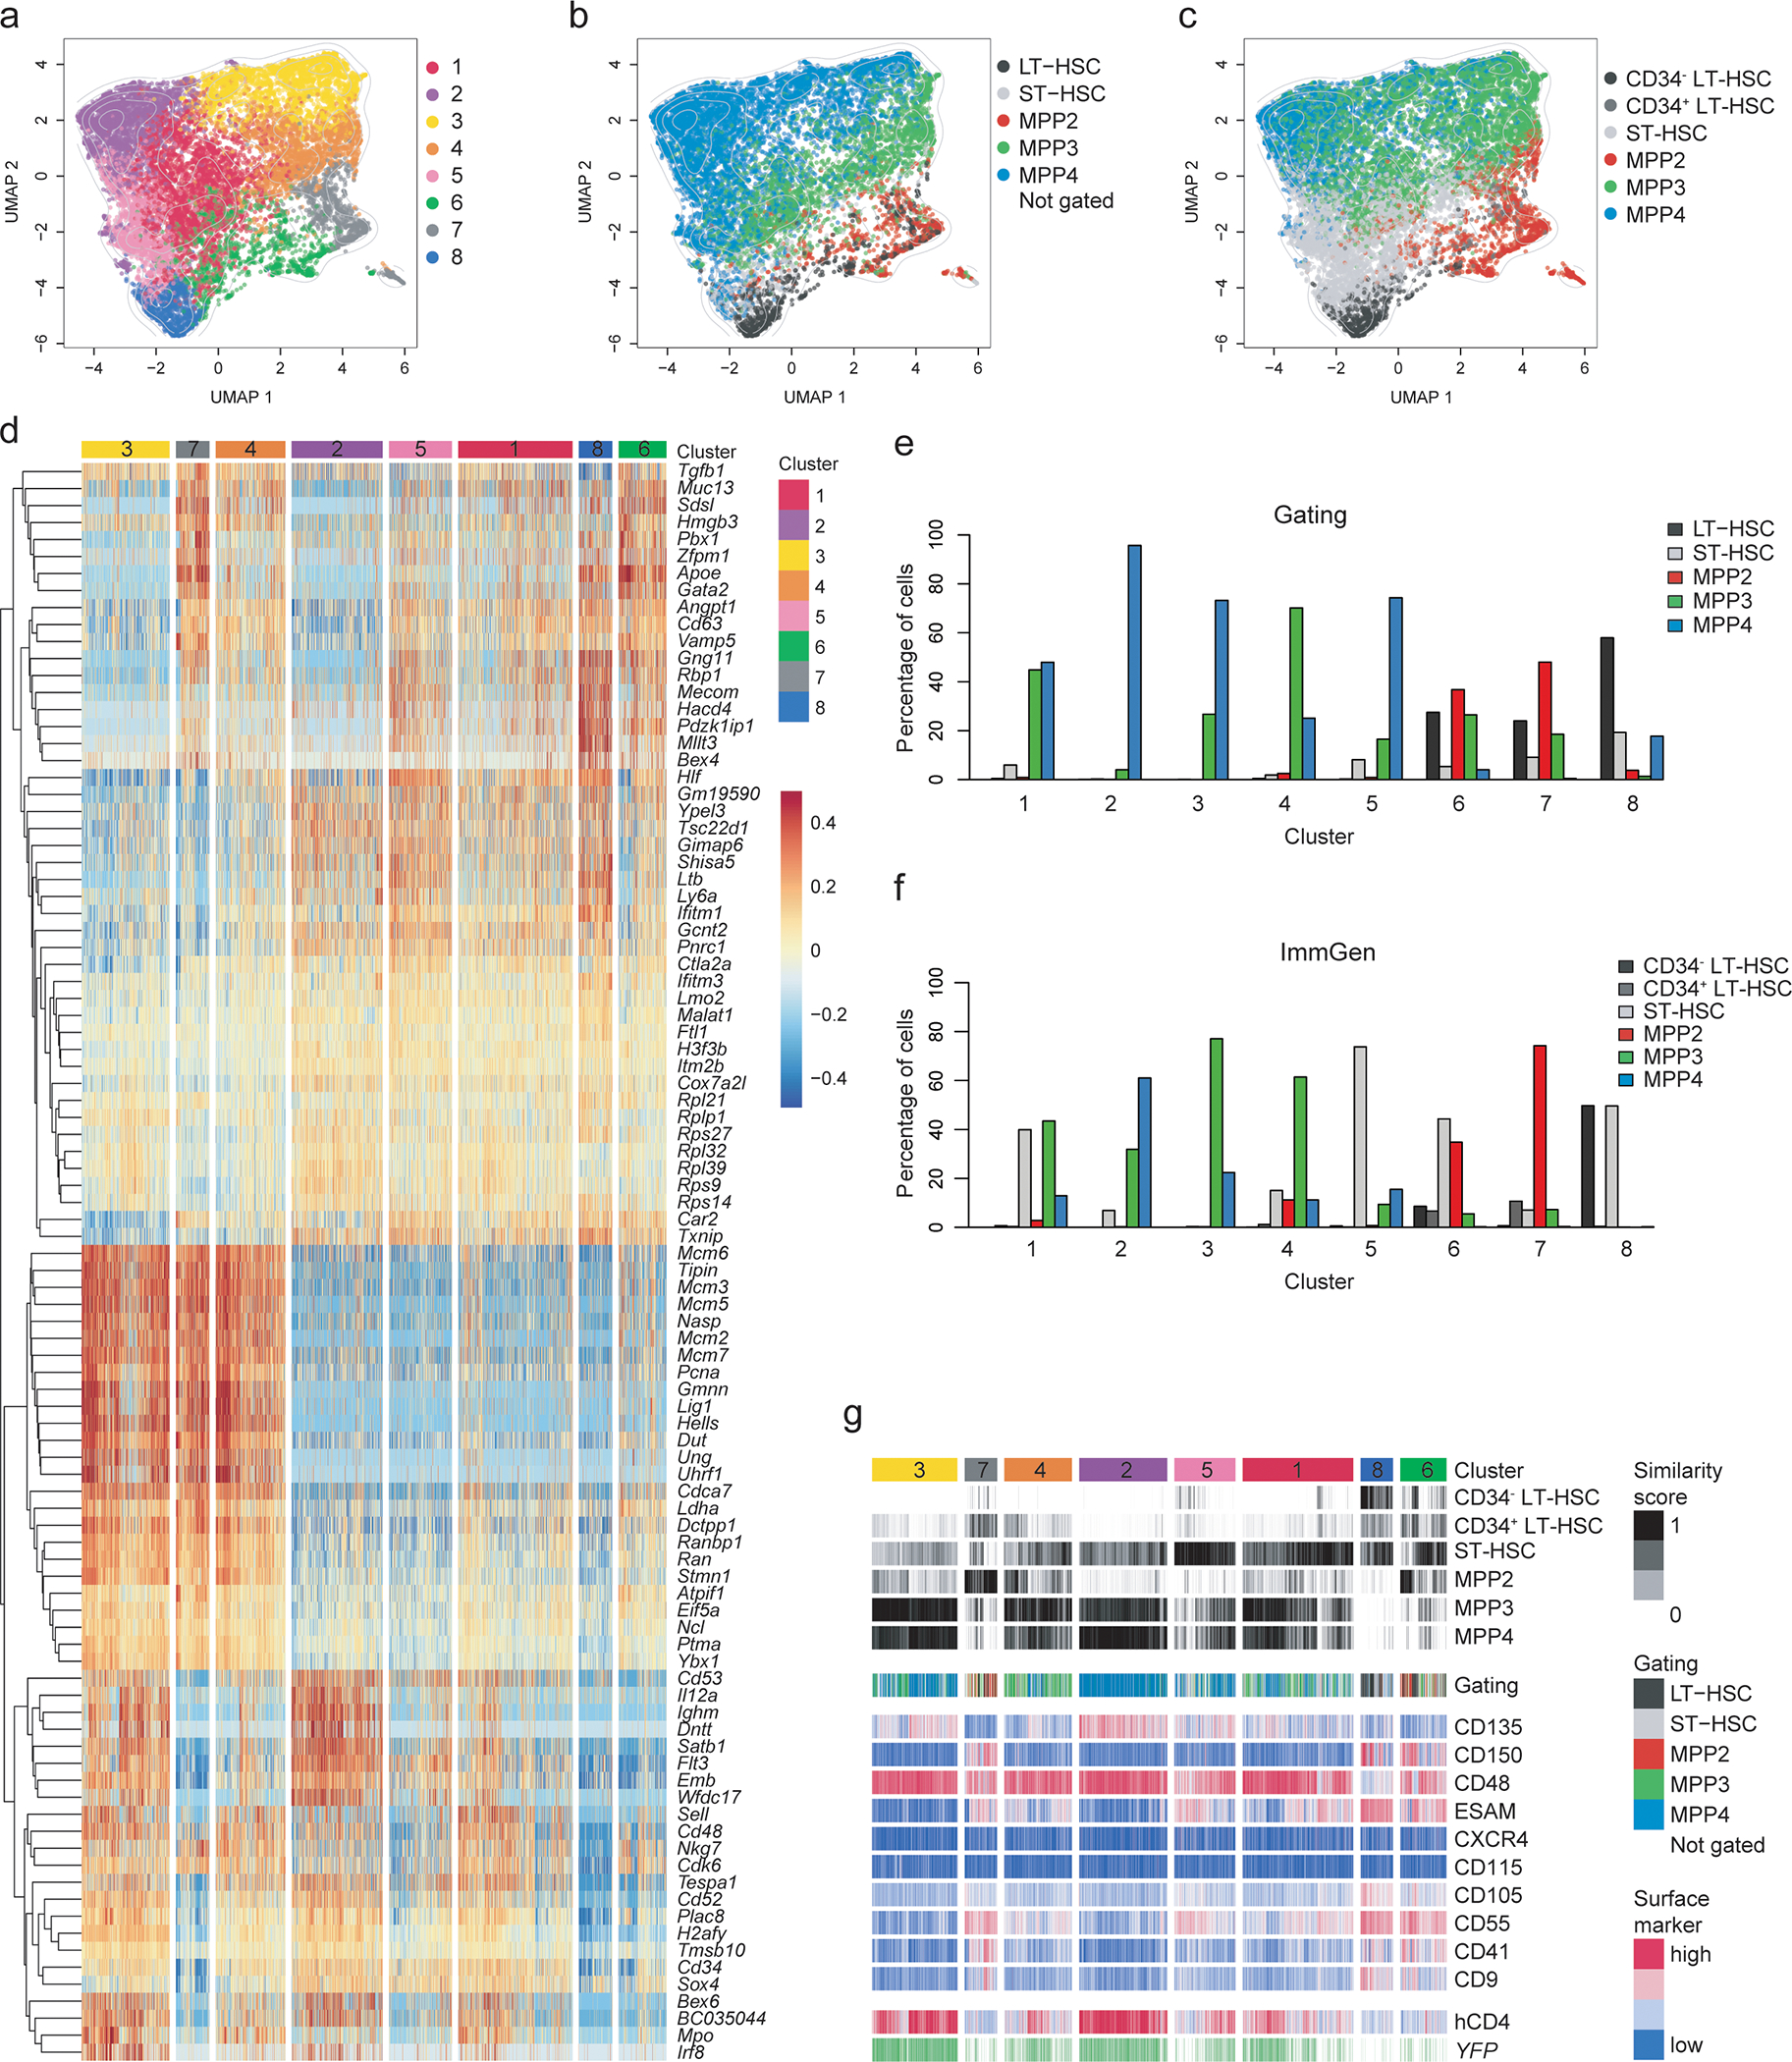
Fig. 4. CITE-Seq reveals heterogeneity and lineage bias within LSKs.

LSK cells isolated from the BM of four 6–8 weeks old TdThCD4/YFP double reporter mice were used for single-cell RNA sequencing in combination with CITE-Seq as described in the methods.
(a-c) Hierarchical clustering analysis was performed on 15,853 LSKs and projected in a 2-dimensional space using UMAP. Each color represents a specific cluster as indicated. (a) Hierarchical clustering identified 8 clusters. (b) Cells were annotated based on CITE-Seq antibody labeling applying an “a posteriori” gating strategy as shown in Extended Data 4e. (c) Cells were annotated based on transcriptional similarity to the ImmGen reference data set and annotated accordingly using the ImmGen subset definition applied for the sorting. (b-c) Cells which could not be assigned to a subset, or a reference population, are not shown. Contour lines display the 2D cell density obtained for (a) on the UMAP space.
(d) Heatmap displaying the centered and scaled expression of the top 30 markers upregulated in each cluster, defined as in (a). Shown are 104 markers. Cells were ordered following the hierarchical clustering tree.
(e-f) Bar graphs showing the percent of cells belonging to each cluster defined as in (a) and distributed according to the “a posteriori” gating strategy used in (b) or according to the ImmGen annotation as defined in (c) as shown in the legend.
(g) Compiled data showing the cluster distribution defined as in (a) (top row) in relation to the similarity score to reference samples from the ImmGen dataset defined as in (c) or the cell-type annotation based on the “a posteriori” gating strategy defined as in (b); The expression of CITE-Seq markers, YFP transcript and hCD4 is centered and scaled.
