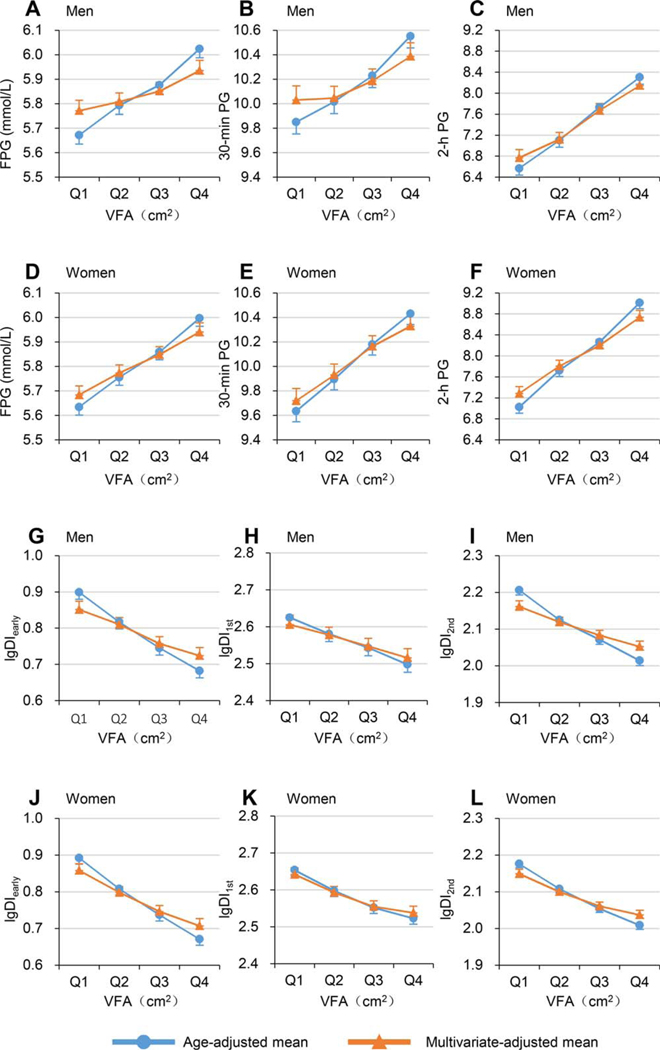
Figure 1.
Age-adjusted and multivariable-adjusted means (95% CIs) of blood glucose and log-transformed disposition indices across increasing VFA quartiles. Dots or triangles represent means, and bars represent 95% CI of the upper or lower bound. Line with dots indicates age-adjusted means. Line with triangles indicates multivariable-adjusted means (adjusted for age, SFA, and BMI). Mean values of FPG, 30-minute PG, and 2-hour PG, in (A-C) men and (D-F) women. Mean values of lgDIearly, lgDI1st, and lgDI2nd in (G-I) men and (J-L) women. DIearly, early-phase disposition index; DI1st, first-phase disposition index; DI2nd, second-phase disposition index; FPG, fasting plasma glucose; lg, log-transformed; PG, plasma glucose; SFA, subcutaneous fat area; VFA, visceral fat area. [Color figure can be viewed at wileyonlinelibrary.com]

