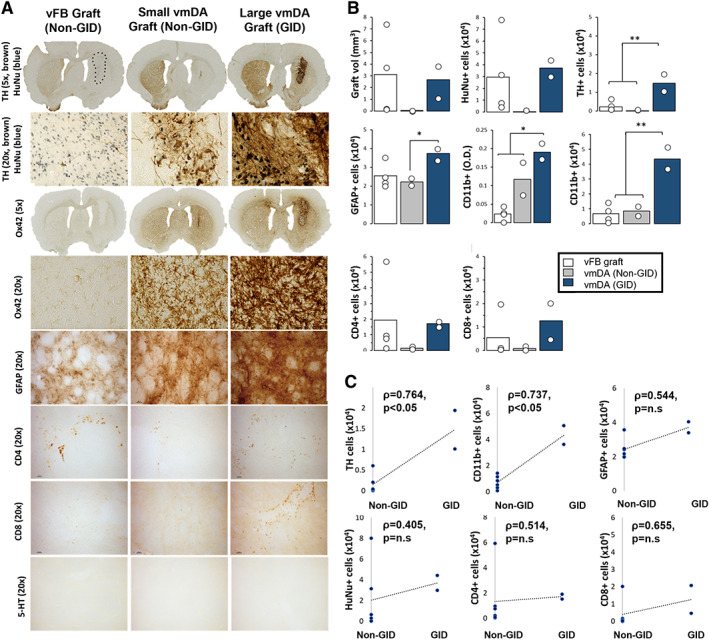
FIG. 2.

(A) Immunohistochemical analysis of hESC‐derived vmDA and vFB grafts. Dopamine neurons (tyrosine hydroxylase [TH], Millipore, MAB318, 1:2000; brown DAB) and human nuclei (HuNu, Millipore, MAB1281, 1:1000; blue VectorSG) at 5× and 20× magnification in vFB grafts, small vmDA grafts from non‐GID rats and large vmDA grafts from GID rats. The HuNu+ graft core of the vFB graft is delineated with a black dashed line. Activated microglia within the graft core and border (Ox42 [CD11b], Serotec, MCA275G, 1:1000) at 5× and 20× magnification in each graft group. Immunolabeling of reactive astrocytes (GFAP, DAKO, Z0334, 1:1000), CD4+ t‐lymphocytes (Abcam, Ab33775, 1:100), CD8+ t‐lymphocytes (Serotec, MC4A48G, 1:500) and 5‐HT+ neuron staining (Immunostar, 20,080, 1:10000). 5‐HT+ “control” staining in the raphe nucleus is shown in the left panel, whereas the center and right panels demonstrate no positive staining in the small or large vmDA grafts. (B) Quantification of cells in hESC‐derived vmDA and vFB grafts. Graft volume, total HuNu+ cells, TH+ cells within the graft, GFAP+ cells within the striatum, Ox42/CD11b optical density within the graft core/border, Ox42 cells/mm3 within the graft core/border, CD4+ cells around the perimeter of the graft and CD8+ cells around the perimeter of the graft were quantified for vFB grafts, small vmDA grafts (non‐GID rats) and large vmDA grafts (GID rats). GID rats had grafts with more TH+ cells than vFB or small vmDA grafts [F2,5 = 10.45, P < 0.05; GID vs. non‐GID and vFB, ps = 0.01] and more GFAP+ cells than grafts in non‐GID rats [F2,5 = 4.20, P < 0.05; GID vs. non‐GID, P < 0.05]. More activated microglia (Ox42+/CD11b+) cells were evident in GID rats than in non‐GID or vFB grafted rats [F2,5 = 21.50, P < 0.05; GID vs. non‐GID and vFB, ps < 0.05]. No other group effects were significant. (C) Correlations between grafted cells and GID behaviors. Significant correlations were revealed between GID and TH+ and Ox42+ cells. No correlations were revealed between GID the total HuNu cell count, GFAP, CD4+ or CD8+ cells. For 5× magnification images, all scale bars = 100 μm; For 20× magnification images, all scale bars = 1000 μm. vFB = ventral forebrain control grafts; vmDA = ventral midbrain ventral mesencephalic grafts. Error bars = standard errors of the mean. *P ≤ 0.05, **P ≤ 0.01, ***P ≤ 0.001.
