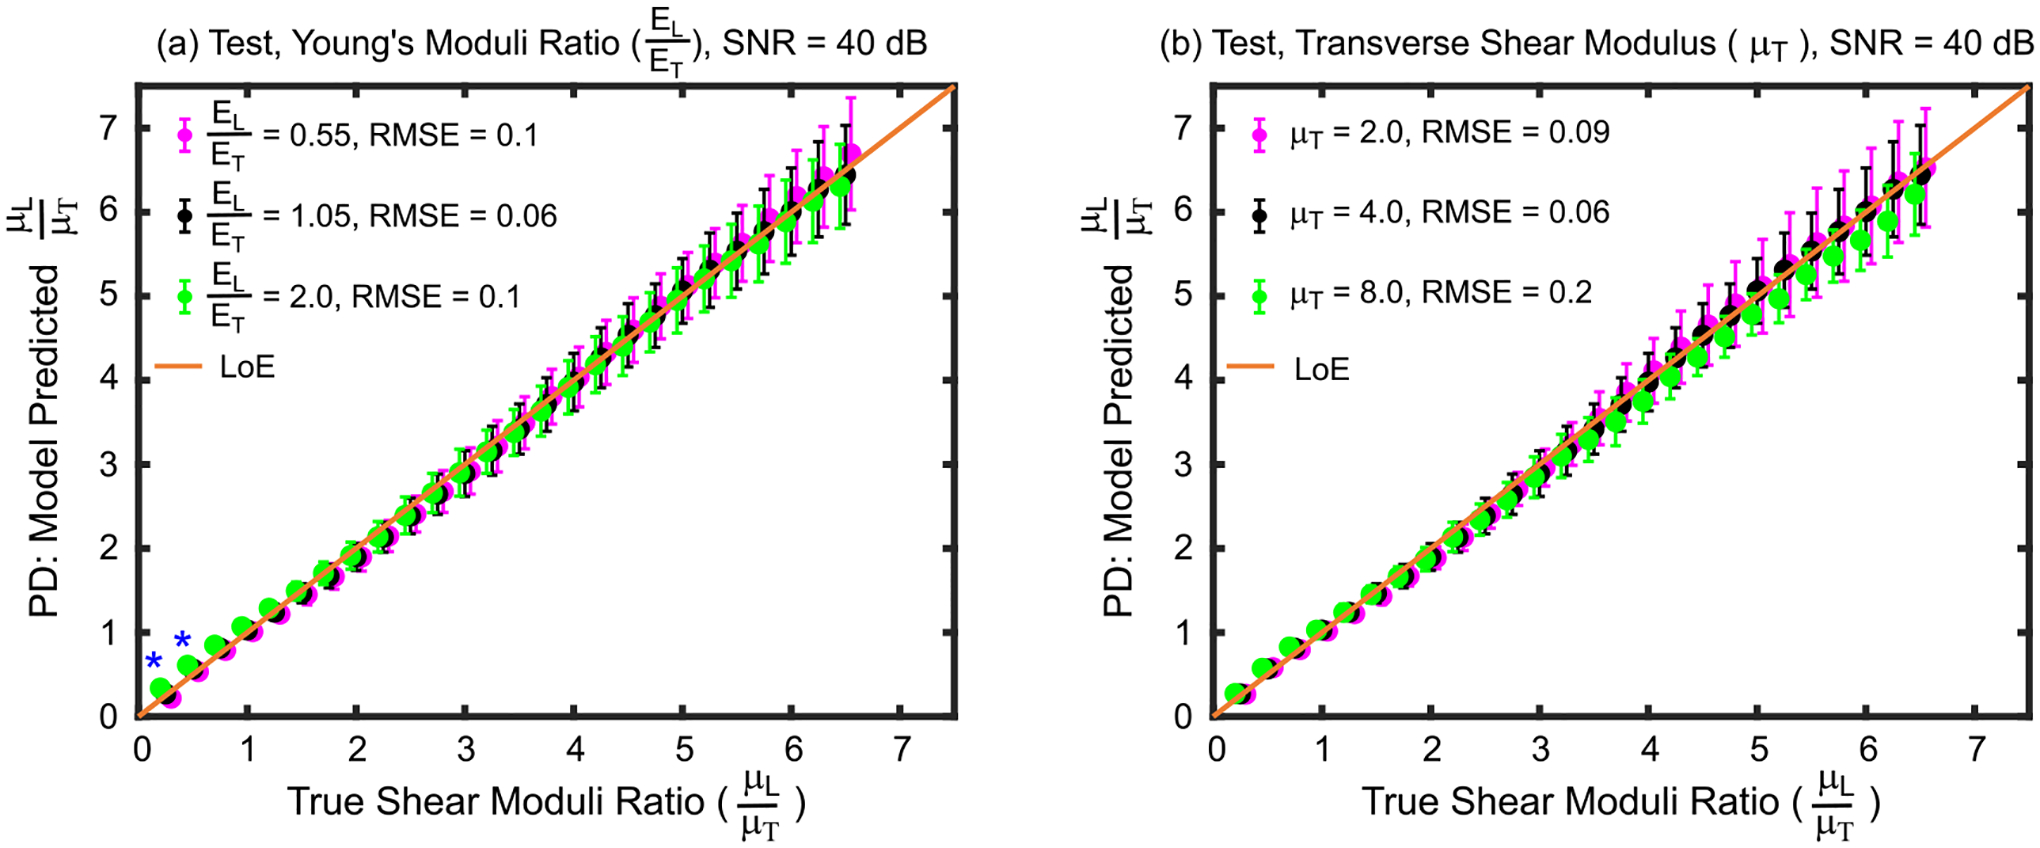
Fig. 2.

Shear moduli ratios predicted by the derived empirical model versus true shear moduli ratios for test set materials with (a) Young’s moduli ratios and (b) transverse shear modulus values that were lower than (magenta), higher than (green), or the same as (black) those of the train set materials used to derive the model. Asterisks (*) indicate statistical difference between predicted shear moduli ratios across Young’s moduli ratios (Kruskal–Wallis one-way analysis of variance, p<0.05). Data are plotted as median ± 0.5×interquartile range over 20 independent speckle realizations. LoE = Line of equivalency, RMSE = root mean square error, SNR = signal-to-noise ratio.
