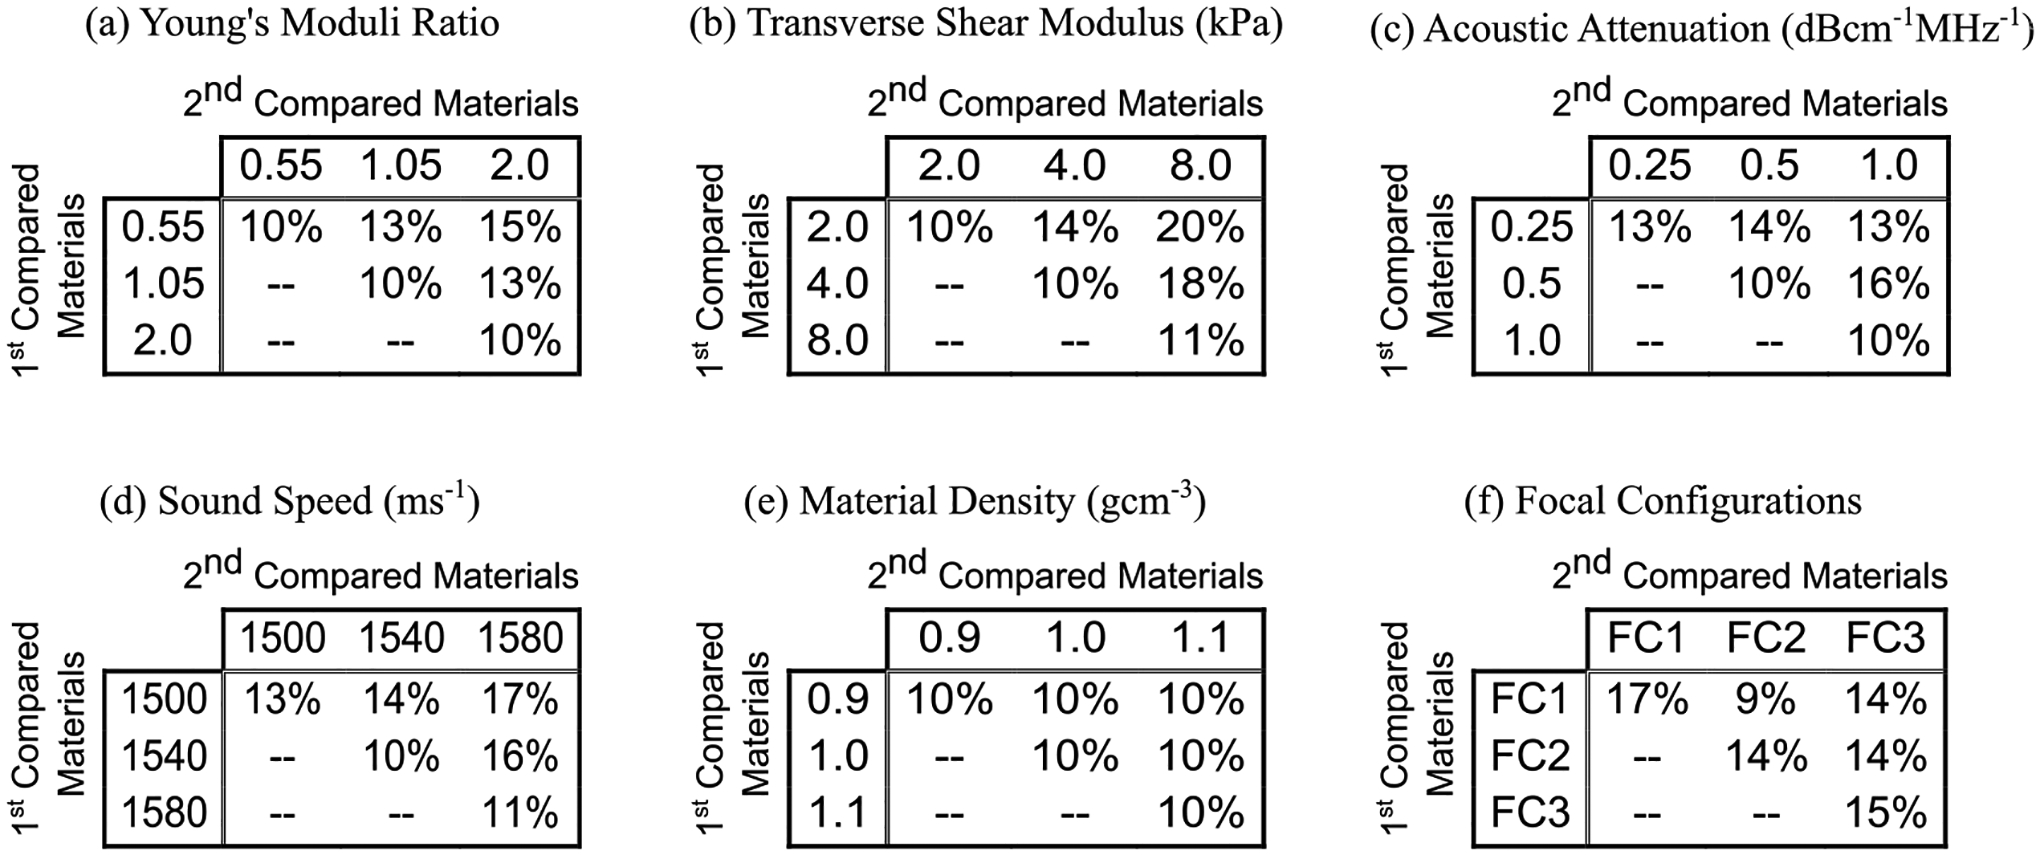
Fig. 6.

Minimum percent difference in true shear moduli ratios needed to differentiate two TI materials by predicted shear moduli ratios when the compared materials’ (a) Young’s moduli ratios, (b) transverse shear moduli, (c) acoustic attenuations, (d) sound speeds, (e) densities, or (f) ARF excitation PSF dimensions were the same or different. In panel (f), FC1, FC2, and FC3 focal configurations represent (latera, elevational) F-numbers of (2.00, 3.40), (2.50, 4.25), and (3.00, 5.10), respectively. For each panel, the center cell (2nd row, 2nd column) corresponds to the case when the training and test materials had the same properties.
