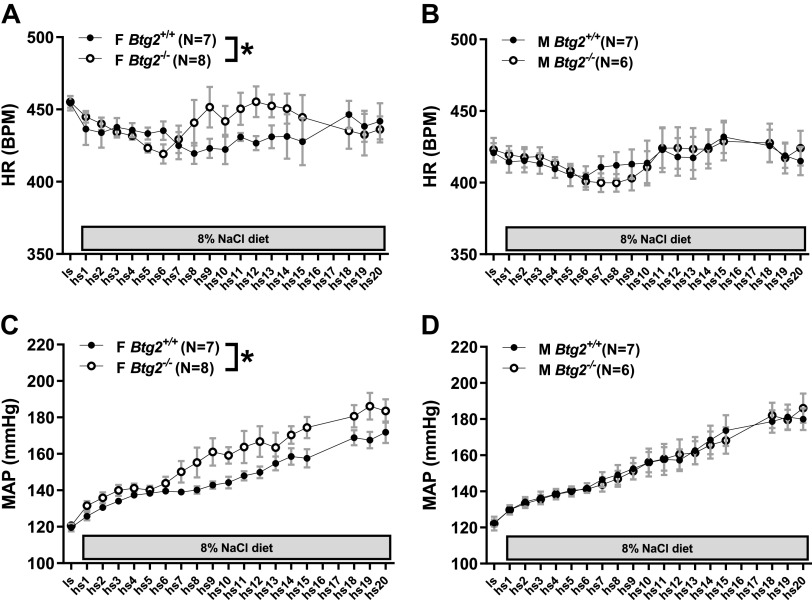
Figure 2.
Blood pressure and heart rate measurements by radiotelemetry. Twenty-four measurements of heart rate in female (A) and male (B) Btg2+/+ and Btg2−/− rats during low-salt diet (LS) and 20 days of high-salt diet (HS). Bottom figures depict 24-h measurements of mean arterial pressure (MAP) in female (C) and male (D) Btg2+/+ and Btg2−/− rats during low-salt diet (LS) and 20 days of high-salt diet (HS). Graphs represent recordings obtained once every 2 min continuously for 24 h. Data are presented as mean shown in circles and SE shown as bars (only depicted in positive direction). Levels of statistical significance were analyzed by two-way ANOVA. *P < 0.05 (strain comparison). BPM, heart rate in beats per minute; F, female; HR, heart rate; M, male.

