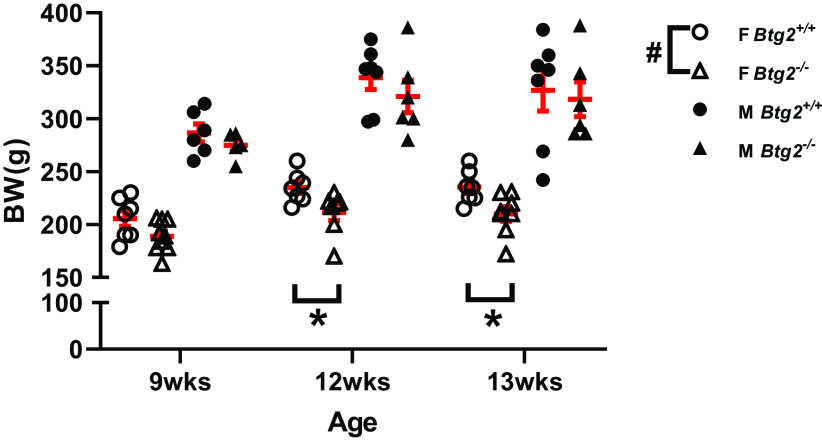
Figure 4.
Decreased body weight in female Btg2−/− compared with Btg2+/+ rats. Nine-week-old animals were switched to high-salt diet and measured after 2 (12 wk) and 3 (13 wk) wk. Individual data presented with means ± SE in red. Statistical significance was analyzed separately within each sex by two-way ANOVA. #P < 0.05 (strain comparison), *P < 0.05 (Sidak post hoc). BW, body weight; F, female; M, male; n = 6–8/group.

