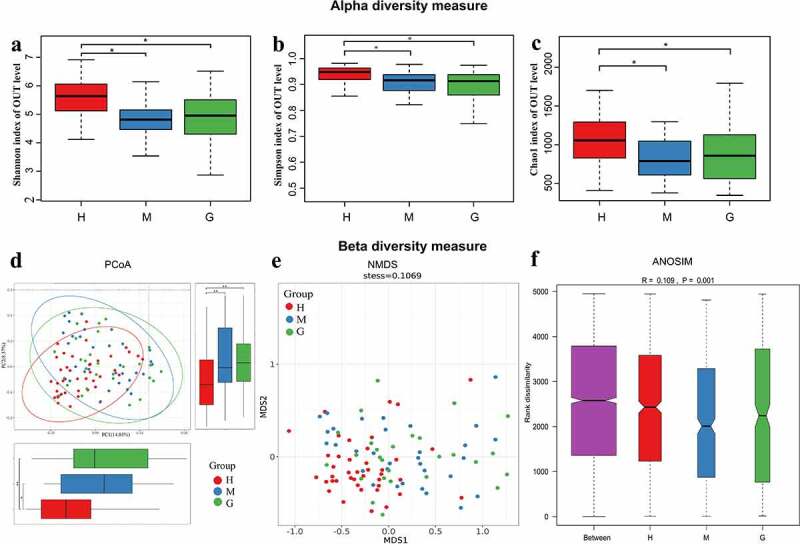
Figure 2.

The alpha and beta diversity of the intestinal flora in healthy subjects and patients with meningioma and glioma. Boxplot of alpha diversity indices, including Shannon (a), Simpson (b), and Chao1 (c) indices. Principal coordinate analysis (PCoA) plot based on unweighted UniFrac distances (A). The horizontal and vertical axes represent the first and second principal coordinates, which explains the greatest proportion of variance to the microbial communities. Each spot represents a sample, and each color represents a group. * 0.01 < p < 0.05; ** p < 0.01; Non-metric Multidimensional Scaling (NMDS) based on Bray-Curtis distances (B). Each spot represents one sample, and each color represents one group. The samples with high similarity of gut microbiome compositions present a close distance in spots. The analysis of similarities (ANOSIM) in healthy subjects and patients with meningioma and glioma (C). The result shows the differences in the inter-group to be significantly greater than in the intra-group (R = 0.109, p = 0.001). †H: healthy group. M: benign meningioma group. G: malignant glioma group.
