
Figure 6.
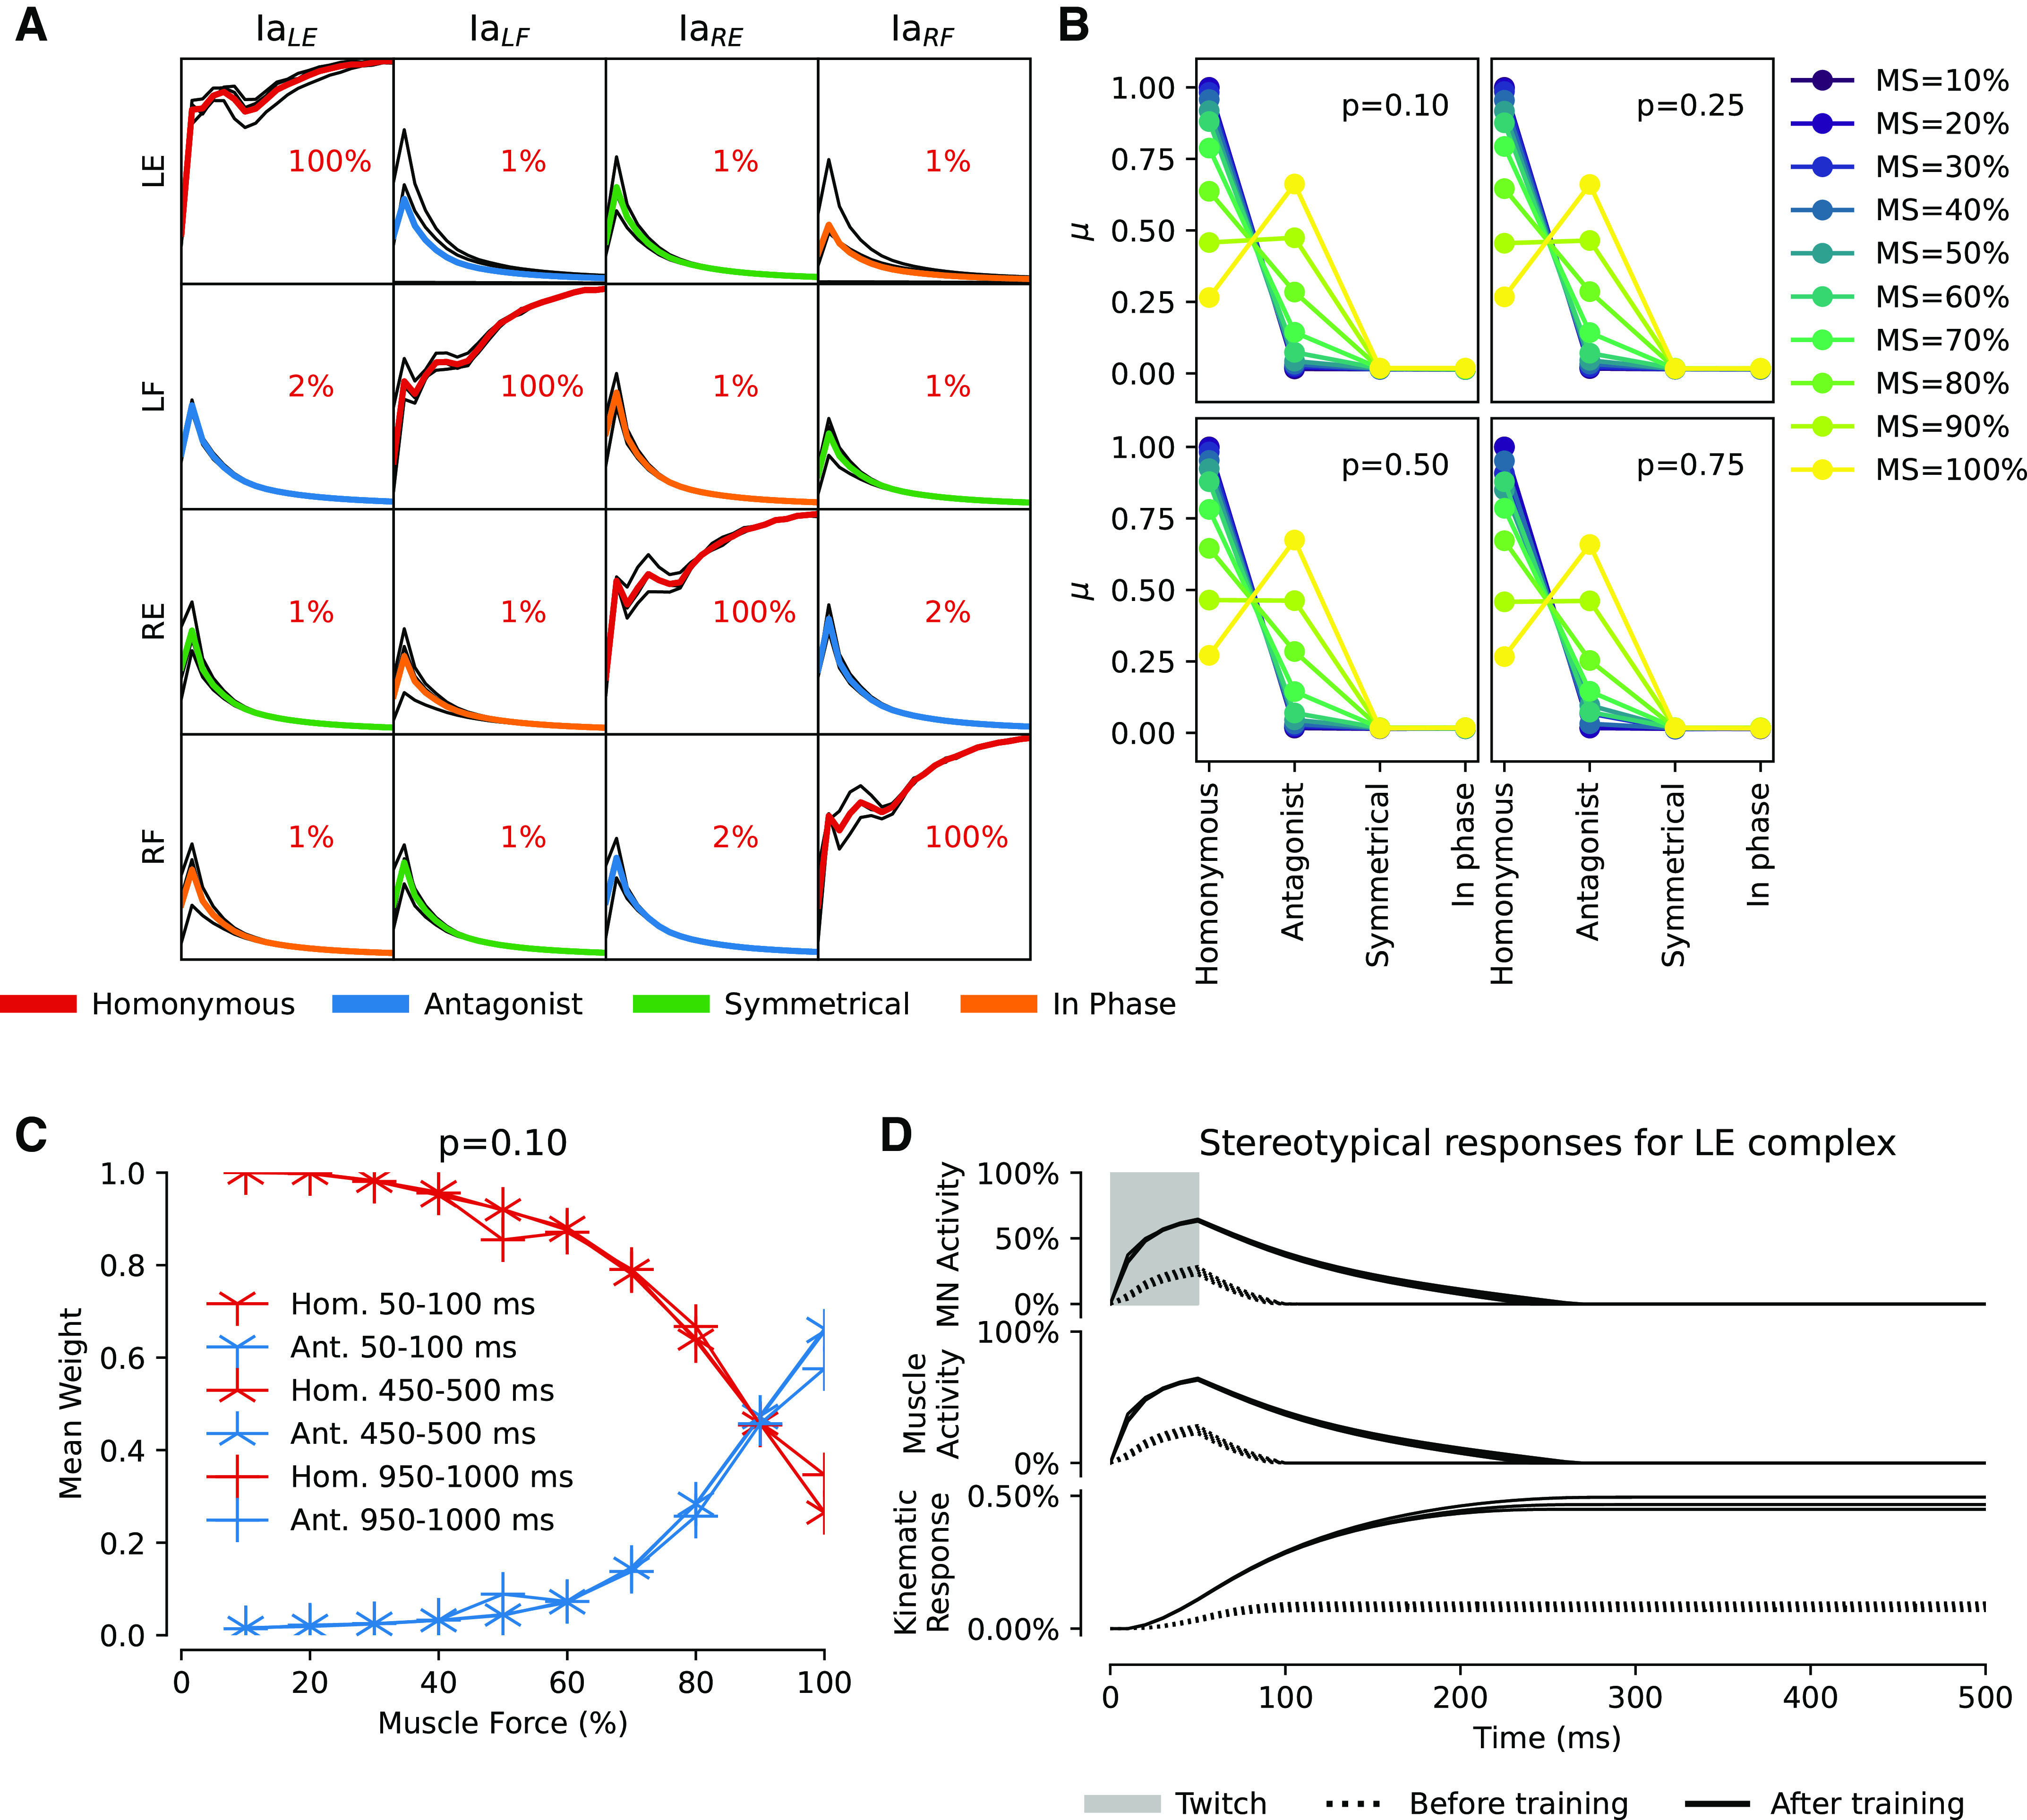
A: matrix of Ia-βMN synaptic weights during 20,000 s of training using the twitch APG with muscle strength at 10% for three different randomizations of initial weights. Each row illustrates one βMN, denoted by which muscle it innervates; incoming Ia synapses are organized in columns, where the subscript indicates the muscle of origin of the sensor. The colored mean lines indicate the functional relationship between the βMN and the sensor according to the legend below. B: summary of additional simulations with varying muscle strength (10%–100% with 10% increments as shown by legend to the right). Each 4-by-4 synaptic weight matrix has been summarized by functional relationship between βMN and sensor as identified in A. Each panel reports mean final synaptic weight (n = 3) as a data point for four different twitch probabilities p indicated. C: mean end weight for homonymous (red lines) and antagonists (blue lines) for different muscle forces (x axis) and twitch durations (different markers as indicated in legend); P = 0.1 for all simulations. Ia inversion is seen at 100% muscle force. D: evolution of motoneuron activity and corresponding kinematic response for the LE muscle in A. Top plot shows LE MN response to a 50-ms square pulse twitch, which is augmented by Ia feedback after training. Middle plot shows respective resulting LE muscle force. Bottom plot shows the kinematic response of the limb. The absolute amplitude of the response is small, but that is to be expected because the muscle force is set to 10% of max. Ia, primary afferent; LE, left extensor; LF, left flexor; MN, motoneuron; MS, muscle strength; RE, right extensor; RF, right flexor.