
Figure 8.
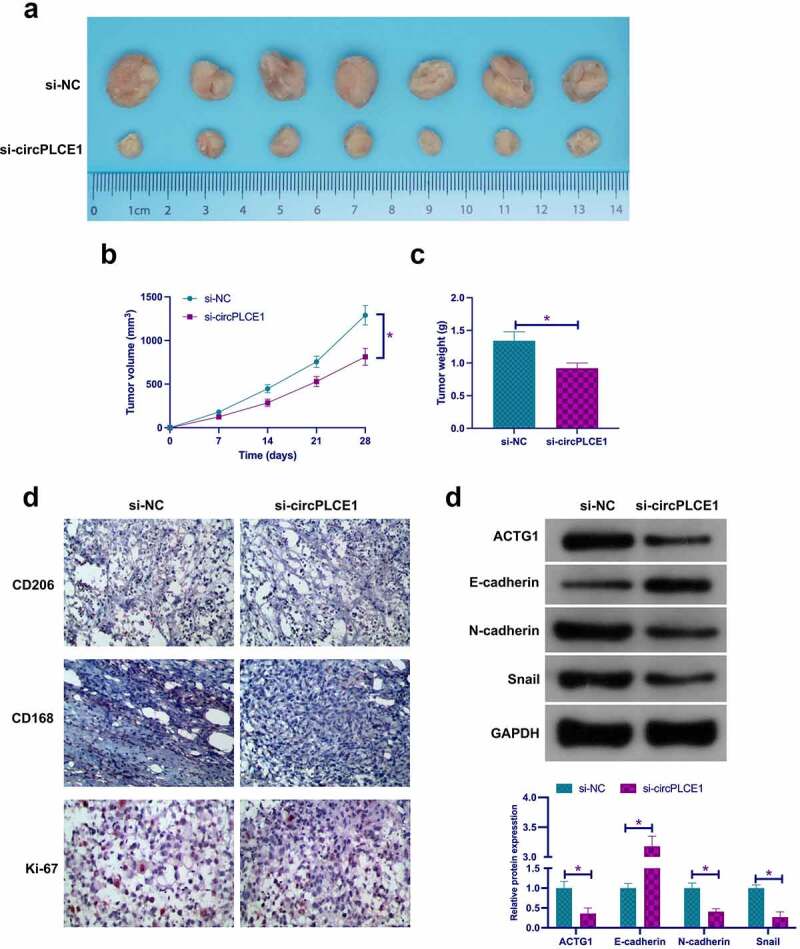
Depressive circPLCE1 refrains tumor growth, TAM M2 polarization, and CRC EMT in vivo a. Representative image of tumor; b. Tumor volume; c. Tumor weight; d. CD206, CD163 and Ki-67 detected via immunohistochemistry; e. In tumor ACTG1, E-cadherin, N-cadherin and Snail detected via Western blot. Expression of the data was as mean ± SD (n = 7); *P < 0.05.