
Figure 2.
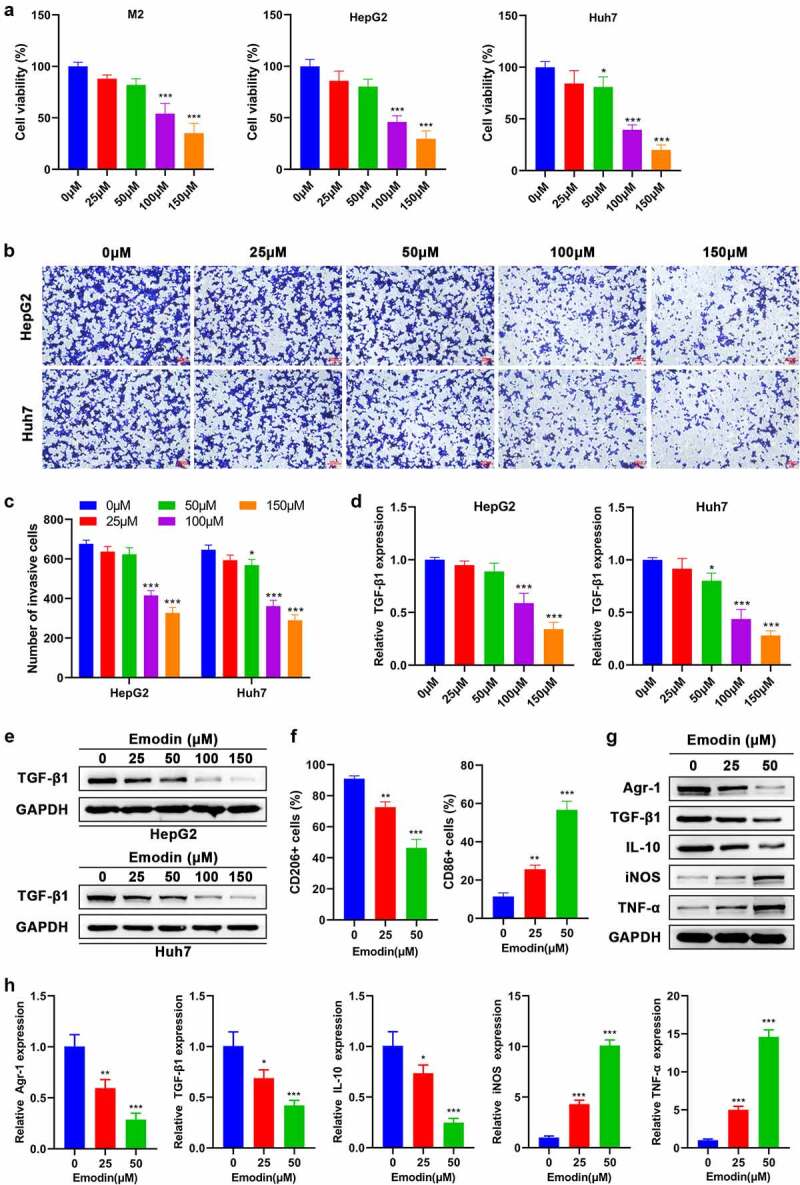
Emodin suppresses the viability of M2 macrophages and HepG2 cells and induces the transformation of M2 to M1 macrophages. (a) Effect of emodin (0, 25, 50, 100, and 150 μM) on the viability of M2 macrophages, HepG2 cells, and Huh7 cells for 24 h. Effect of emodin (0, 25, 50, 100, and 150 μM) on the (b-c) invasion, (d) TGF-β1 mRNA expression, and (e) TGF-β1 protein levels of HepG2 and Huh7 cells for 24 h. M2 macrophages were treated with 0, 25, and 50 μM emodin for 24 h, and (f) CD206 and CD86 expression of M2 macrophages was analyzed by FCM; (g) The protein and (h) mRNA expression of Arg1, TGF-β1, IL-10, iNOS, and TNF-α in M2 macrophages was assessed by Western blot and RT-qPCR, respectively. *P < 0.05, **P < 0.01, and ***P < 0.005, vs. 0 μM.