Fig. 2.
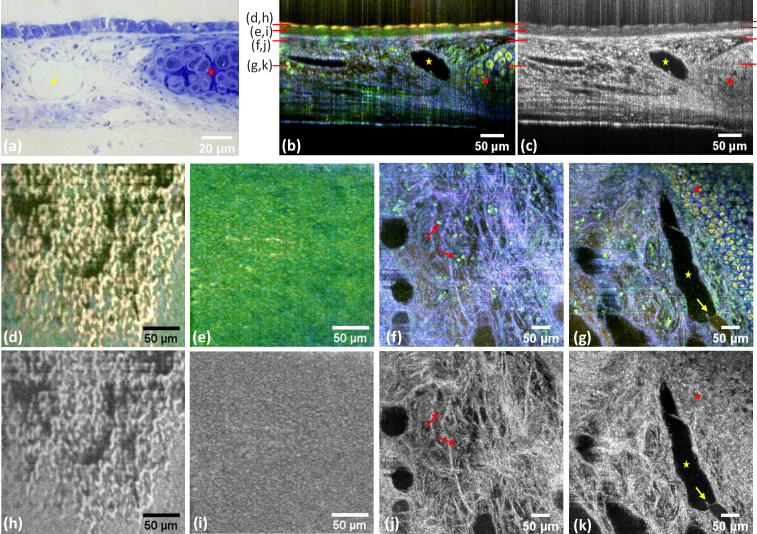
Images of ex vivo mouse trachea from one acquired volume. (a) Exemplary semi thin section stained with methylene blue-azure II from a murine trachea. (b) Dynamic mOCT B-scan and (c) corresponding averaged mOCT B-scan. (d-k) En face images of the same tissue at different planes marked red in the preceding B-scans. Dynamic contrast is shown in the center line (d-g) and the corresponding averaged mOCT image below (h-k). (d,h) Cilia, (e,i) epithelium, (f,j) connective tissue layer with immune cells (marked by red arrows) (g,k) connective tissue, cartilage (red star) and lymphatic vessel (yellow star) with valve (marked by yellow arrow).

