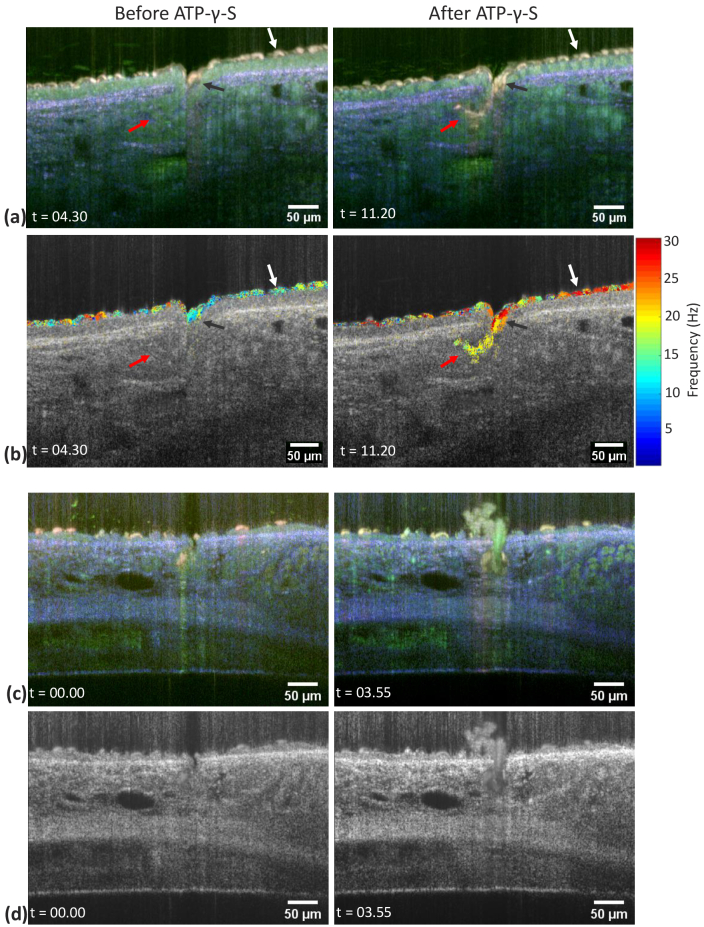
Fig. 3.
Gland secretory ducts in two ex vivo mouse tracheas. B-scans prior to and after ATP- -S stimulation are shown. (a) Dynamic mOCT B-scans, (b) corresponding dominant frequencies of segmented cilia superimposed on the averaged gray scale image. Different cilia are indicated by a red, white and black arrow for further detailed frequency analysis. (c) Dynamic mOCT B-scan of a different sample during secretion (d) corresponding averaged mOCT B-scan. Entire time-lapse image sequence is shown in Visualization 1 (131.6MB, avi) , Visualization 2 (176.9MB, avi) and Visualization 3 (51.2MB, avi) . Time (t) is shown in minutes:seconds format.

