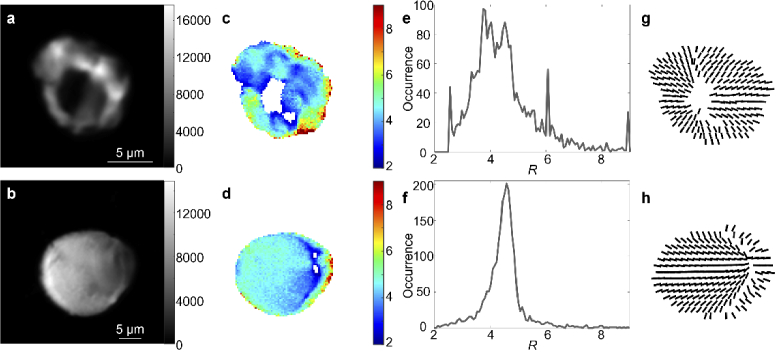
Fig. 2.
PIPO SHG analysis of otoconia. SHG intensity images of two otoconia obtained by summing all images in a PIPO SHG image stack (a, b), color-coded maps of the fitted R values (c, d), the corresponding occurrence histograms of the fitted R values (e, f) in the color-coded maps (c, d, respectively) and the fitted orientation of the crystal axis ( ) for each 6th pixel (g, h).

